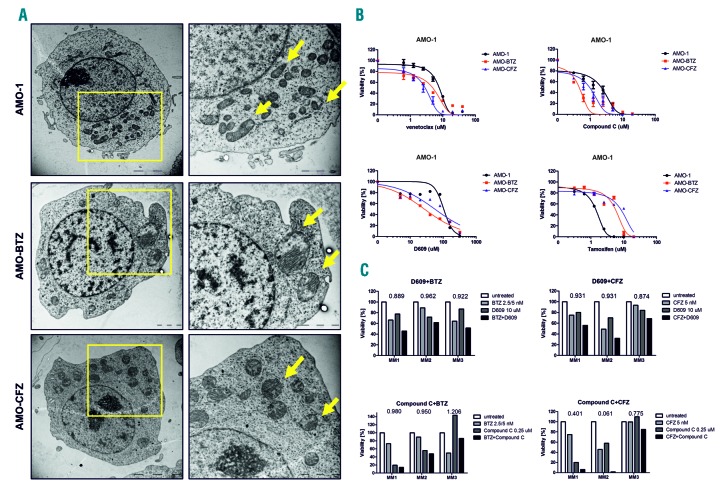
Figure 3.
Changes in mitochondria morphology, energy demand and lipid composition in proteasome inhibitor-resistant cells. (A) The mitochondria in proteasome inhibitor (PI)-resistant AMO cells show prominent changes. The panels on the left show transmission electron microscopy images of whole cells, whereas those on the right are zoomed-in areas of the cell in the left panel with mitochondria indicated by the arrows. (B) Dose-response curves of PI-sensitive and PI-resistant AMO-1 cells (BTZ = bortezomib, CFZ = carfilzomib) to drugs targeting mitochondria, energy metabolism and lipid homeostasis: a BCL2 inhibitor (venetoclax), an AMPK inhibitor (compound C), a sphingomyelin synthase inhibitor (D609) and a sphingolipid metabolism inhibitor (tamoxifen). The half maximal inhibitory concentration (IC50) values are presented in Online Supplementary Table S3. Data represent the mean ± standard error of mean of three independent measurements. (C) Primary malignant plasma cells were exposed for 48 h to bortezomib (BTZ; MM1: 5 nM, MM2: 2.5 nM, MM3: 5 nM) and carfilzomib (CFZ; all 5 nM) alone or in combination with 0.25 μM compound C or 10 μM D609.

