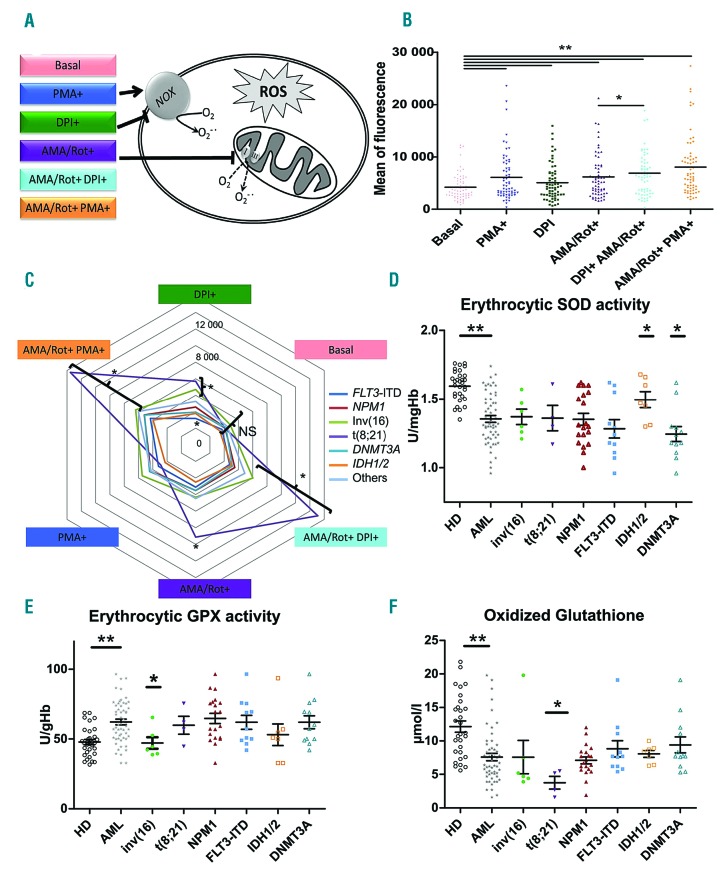
Figure 1.
Reactive oxygen species profiles and antioxidant markers of leukemic cells. (A) Schema of reactive oxygen species (ROS) modulators stimulating or inhibiting NADPH oxidase and mitochondria used in the ex vivo ROS assays. (B) ROS profiles showing the effects of different ROS modulators in blast cells from bone marrow. Statistical analysis: Wilcoxon test for paired samples. (C) Spider chart of ROS profiles according to leukemic abnormalities. Colored lines represent leukemic abnormalities. Note that ROS profiles from t(8;21), inv(16) patients showed more variability in ROS production after the addition of modulators. “Others” refers to acute myeloid leukemia (AML) that did not express any of the listed abnormalities. (D) Distribution of erythrocytic superoxide dismutase activity at diagnosis in healthy donors (HD) and AML patients according to genetic abnormalities. (E) Distribution of erythrocytic glutathione peroxidase activity in HD and AML patients according to genetic abnormalities. (F) Distribution of oxidized glutathione in HD and AML patients according to genetic abnormalities. (B, D, E, F) *P<0.05, **P<0.01. PMA: phorbol 12-myristate 13-acetate; DPI: diphenyleneiodonium; AMA: antimycin A; Rot: rotenone; NOX: NADPH oxidase; SOD: superoxide dismutase; GPX; glutathione peroxidase.

