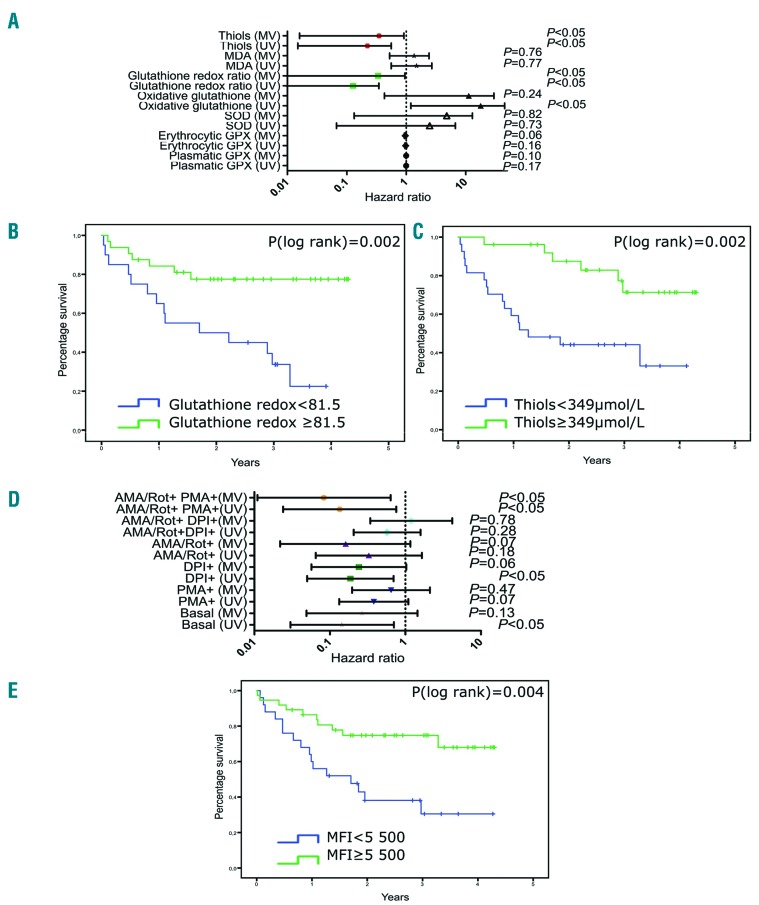
Figure 3.
Prognostic value of antioxidant markers and leukemic reactive oxygen species profiles. (A) Forest plot representing the risk of death (with hazard ratios and 95% confidence intervals) according to antioxidant markers and malondialdehyde levels. (B) Kaplan-Meier survival curves of patients with acute myeloid leukemia (AML) receiving chemotherapy according to the cut-off for reduced/oxidative glutathione ratio (< vs. ≥81.5). (C) Kaplan-Meier survival curves of AML patients receiving chemotherapy according to the cut-off for thiol levels (< or ≥349 μmol/L). (D) Forest plot representing the risk of death (with hazard ratios and 95% confidence intervals) according to reactive oxygen species (ROS) production by leukemic cells from bone marrow exposed to different ROS modulators (log-transformed variables). (E) Kaplan-Meier survival curves of AML patients receiving chemotherapy according to the cut-off for mean fluorescence intensity (MFI) in response to ROS modulators (< vs. ≥5,500). High levels of MFI were predictive of survival (P=0.004). MV: multivariate analysis; UV: univariate analysis; MDA: malondialdehyde; SOD: superoxide dismutase; GPX: glutathione peroxidase; AMA: antimycin A; Rot: rotenone; PMA: phorbol 12-myristate 13-acetate; DPI: diphenyleneiodonium.

