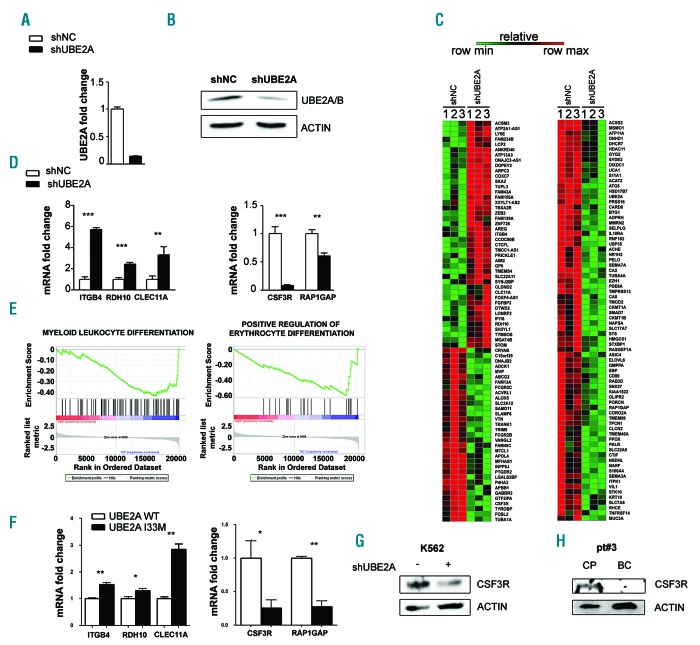
Figure 2.
UBE2A silencing in K562 cells. (A) Real-time quantitative polymerase chain reaction (RT-qPCR) analysis of total RNA extracted from K562 cell lines infected with a lentiviral based system for UBE2A silencing (shNC: scrambled negative control; shUBE2A: UBE2A silenced cells). Values are normalized on shNC cells (***P<0.0001). (B) Western blot analysis of total cell lysates from K562_shNC and K562_shUBE2A cells. (C) Heat map of RNA-sequencing data showing color-coded expression levels of differentially expressed genes in three distinct populations of K562-shUBE2A compared to control (shNC). (D) RT-qPCR analysis in K562 cell lines of a subset of differentially expressed genes identified by RNA-sequencing. (E) Gene set enrichment analysis of the shUBE2A transcriptome. (F) RT-qPCR analysis in the 32Dcl3 cell line of a subset of differentially expressed genes identified by RNA-sequencing. (G and H) CSF3R protein levels in total cell lysate of K562 cells (G) and of BC/CP samples from patient #3, carrying UBE2A mutation in the BC phase (H).

