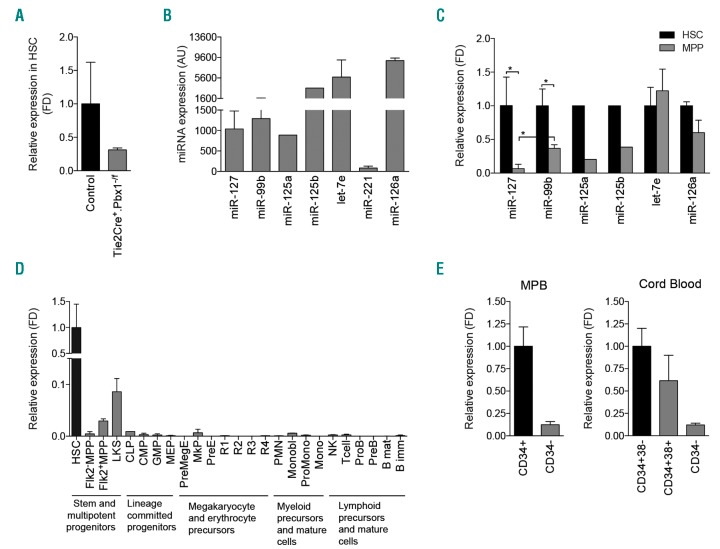
Figure 2.
Expression of miR-127-3p. (A) Histogram shows fold difference (FD) of miR-127-3p expression in hematopoietic stem cell (HSC) from 3-4-week old Tie2Cre+Pbx1−/f mice relative to HSC from Tie2Cre-Pbx1+/f littermate controls, as measured by quantitative real-time polymerase chain reaction (qRT-PCR). Due to the extreme paucity of stem cells from the Tie2Cre+Pbx1−/f model,4 HSC from nine mice were grouped in two pools to perform qRT-PCR; bars indicate the range. (B) Expression of the indicated miRNA in HSC from 4-12-week old wild-type (wt) mice as measured by qRT-PCR and expressed in arbitrary units (AU). (C) Expression of the indicated miRNA in multi-potent progenitors (MPP) from wt mice relative to their expression level in HSC. (B and C) miR127-3p and let-7e, n=4; miR-99b, n=8; miR-125a and miR-125b, n=1; miR-221, n=6; miR-126a, n=2; n: number of pools (2-5 mice/pool). For miR-126, bars indicate the range. (D) miR-127-3p expression level in steady state bone marrow cell subpopulations from two pools of wt mice (2-3 mice/pool). (E) qRT-PCR analysis of miR-127 expression in human hematopoietic mature CD34− cells (or in CD34+CD38+ progenitors) relative to the CD34+ mobilized peripheral blood (MPB) or CD34+CD38− cord blood (CB) compartments. N=2 healthy donors for each source, bars indicate the range. All donors signed informed consent. When miRNA expression is indicated as FD, black bars indicate the sample relative to which FD is calculated.

