Figure 3.
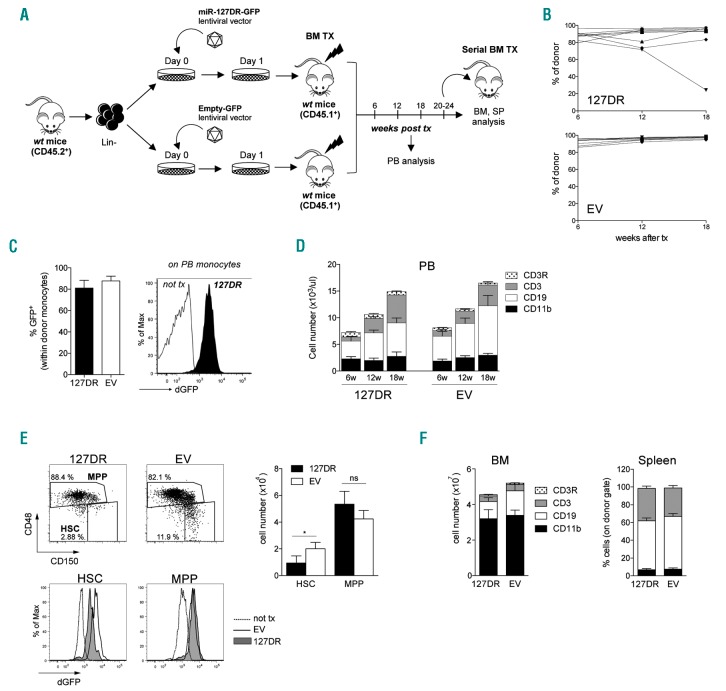
Inhibition of miR-127-3p function leads to hematopoietic stem cell (HSC) depletion. (A) Experimental workflow. (B) Level of engraftment of transduced cells over time, measured as percentage of cells expressing the donor marker CD45.2 within total peripheral blood (PB) CD45+ cells. Graphs show engraftment in individual mice transplanted with Lin− cells transduced with 127DR (top, n=11) or empty vector (EV) (bottom, n=9). Tx: transplant. (C) dGFP expression in PB donor monocytes measured by FACS analysis 18 weeks after transplant. (Left) Average of eight mice; (right) representative FACS histogram. (D) Kinetics of multi-lineage differentiation of transduced cells during PB sampling (6-12-18 weeks). Histograms show the absolute cell number, determined by hemocytometer analysis, and stacked columns represent the relative abundance of each population (CD11b+ myeloid cells, CD19+ B cells, CD3+ T cells; CD3R: T cells from recipient), determined by FACS analysis (n=6-8). (E) FACS analysis of 127DR and EV stem and progenitor cells in the bone marrow (BM) of transplanted mice. (Left) Representative FACS analysis of HSC and multi-potent progenitors (MPP) gated on LKS (dot plots) and of their dGFP expression (bottom histograms) compared to that of a representative non-transplanted mouse. (Right) Average of HSC and MPP absolute numbers (n=6-7). (F) Central and peripheral multi-lineage differentiation by transplanted 127DR-and EV-transduced cells in primary recipients. Histograms show absolute BM cell numbers (left) and percentage of donor cells in the spleen (right). Stacked columns represent relative abundance of each lineage (n=6-8). All graphs summarize results from two independent experiments, and BM cells counts are relative to one femur and one tibia.

