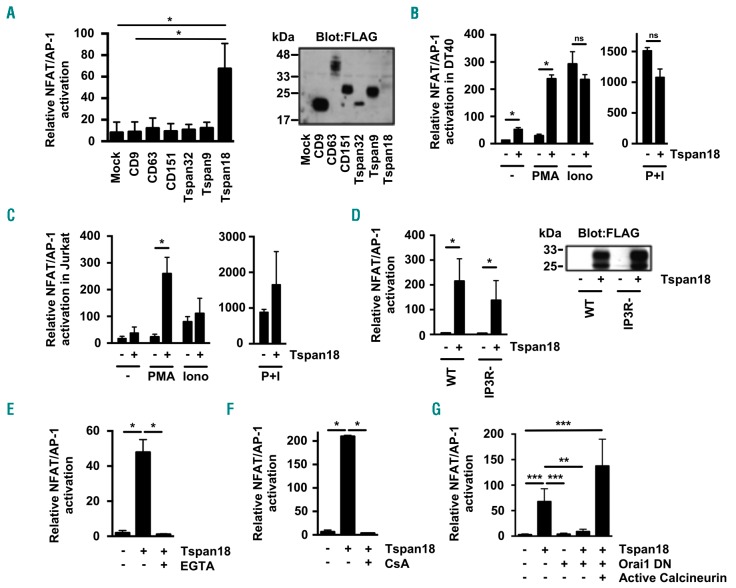
Figure 3.
Tspan18 overexpression in cell lines activates Ca2+-responsive NFAT signaling in an Orai1-dependant manner. (A) The DT40 B cell line was transfected with an NFAT/AP-1-luciferase reporter construct, a β-galactosidase expression construct driven by the elongation factor (EF)-1a promoter to control for transfection efficiency, and FLAG-tagged mouse tetraspanin constructs or empty vector control. At 24 hours (h) post transfection, cells were lyzed and assayed for luciferase and β-galactosidase. Luciferase data were normalized for β-galactosidase values (left). Whole cell lysates from these cells were separated by SDS-PAGE and blotted with an anti-FLAG antibody. (Right) Representative blot. (B and C) The DT40 B cell line (B) and the human Jurkat T cell line (C) were transfected with an NFAT/AP-1-luciferase reporter construct and β-galactosidase expression construct with (+) or without (-) FLAG-tagged mouse Tspan18. At 24 h post transfection cells were stimulated for 6 h with 50 ng/mL PMA or 1 μM ionomycin (Iono) (left), or both together (right). Luciferase assays were then performed as described in (A). (D) DT40 cells with (+) or without (−) expression of FLAG-tagged mouse Tspan18 were tested for NFAT/AP-1 luciferase activity as described in (A), but using cells with gene knockouts of the three IP3 receptors (IP3R-) in comparison to wild-type (WT) cells (left). Whole cell lysates were western blotted with an anti-FLAG antibody (right). (E and F) DT40 cells with (+) or without (-) expression of FLAG-tagged mouse Tspan18 were tested for NFAT/AP-1 luciferase activity as described in (A), except that cells were treated with 4 mM EGTA as a Ca2+ chelator (E) or with 2 μM cyclosporin A as a calcineurin inhibitor (F). (G) DT40 cells were transfected with FLAG-tagged human Tspan18 in the presence or absence of a dominant negative human Orai1 E106Q mutant construct, or a consitutively active human calcineurin construct. The experiment was conducted as described for (A). All luciferase data were corrected for β-galactosidase values, normalized by logarithmic transformation, and analyzed by one-way ANOVA and Tukey’s multiple comparison test. *P<0.05; **P<0.01; ***P<0.001. Error bars represent the Standard Error of the Mean from at least three independent experiments. ns: not significant.

