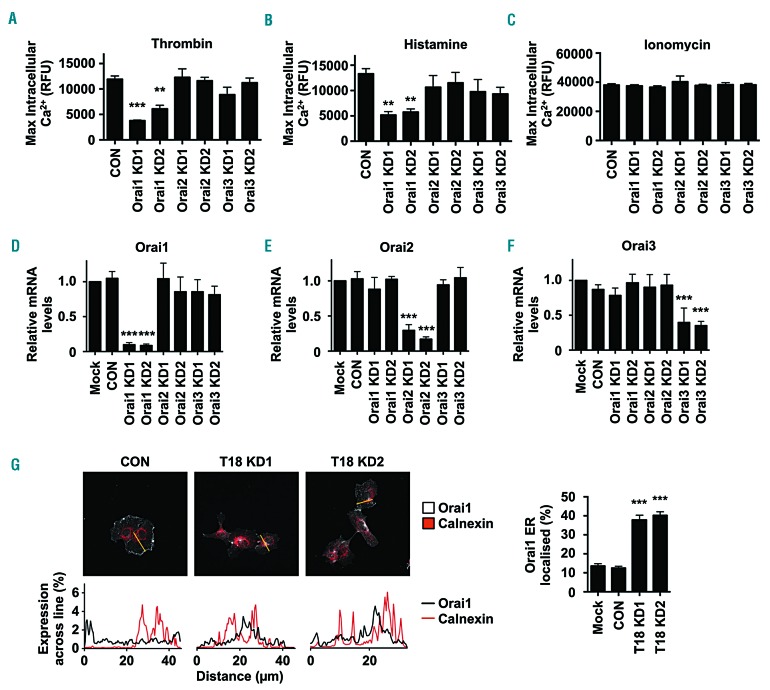
Figure 5.
Orai1-knockdown endothelial cells have impaired Ca2+ mobilization and Orai1 surface expression requires Tspan18. (A-F) Human umbilical vein endothelial cells (HUVEC) were transfected with a negative control siRNA (CON) or with one of two independent siRNA targeting Orai1, Orai2 or Orai3 (Orai1-3 KD). After 48 hours (h), Ca2+ measurements were taken as described in Figure 2A-C, following addition of 1 U/mL thrombin (A), 20 μM histamine (B), or 10 μM ionomycin (C), and quantitation of maximum intracellular Ca2+ concentrations is shown. Error bars represent Standard Error of the Mean (SEM) from three independent experiments. **P<0.01; ***P<0.001. (D-F) siRNA-transfected HUVEC from (A-C) were subjected to quantitative real-time polymerase chain reaction (qPCR) for Orai1 (D), Orai2 (E) or Orai3 (F), as described for Figure 2D. Error bars represent SEM from three independent experiments. ***P<0.001. (G) HUVEC lentivirally-transduced to express Myc-tagged Orai1 were treated with control or Tspan18 siRNA. Cells were stained with anti-Myc (white) or anti-calnexin endoplasmic reticulum marker (red) antibodies, and representative confocal microscopy images are shown (top). In the line graphs below the images (bottom), the percentage expression of Orai1 (black) and calnexin (red) across the yellow line in the top panel was determined using ImageJ. The percentage of Orai1 that localized to a calnexin endoplasmic reticulum mask was then quantified (right). Data were generated from 15 cells per condition from three independent experiments (five cells per condition per experiment). Error bars represent SEM. ***P<0.001. RFU: relative fluorescence unit.

