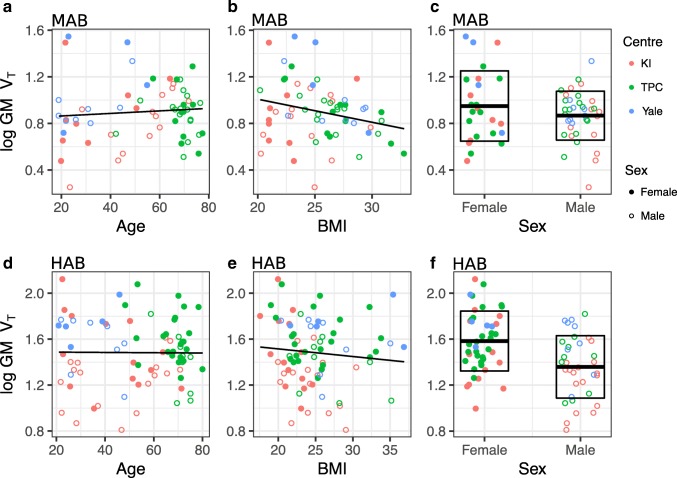
Fig. 1.
The relationships of age, BMI and sex to log-transformed grey matter [11C]PBR28 VT. Age vs. [11C]PBR28 GM VT in MAB genotype (A) and HAB genotype (B). BMI vs. [11C]PBR28 GM VT in MAB genotype subjects (C) and HAB genotype subjects (D). Sex vs. [11C]PBR28 GM VT in MAB genotype subjects (E) and HAB genotype subjects (F). Box-plots in (E) and (F) represent the data means and standard deviations for both sexes

