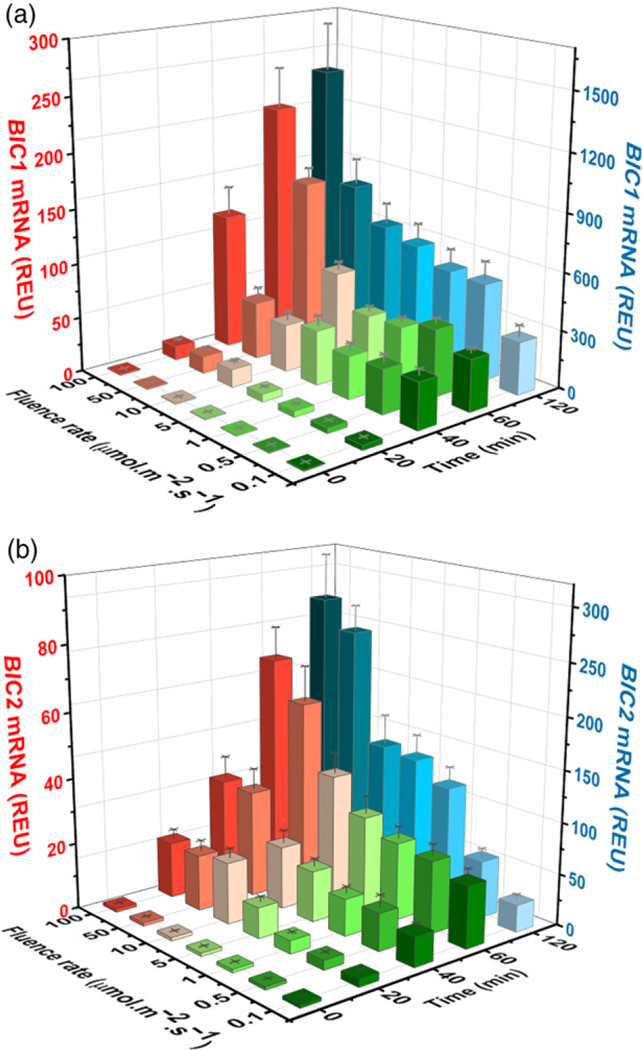
Figure 2. Blue light-induced mRNA expressions of the BIC1 and BIC2 genes.

(a, b) 5-day-old etiolated wild-type seedlings were exposed to blue light with different fluence rates for the indicated time before sample collection. Relative mRNA levels of BIC1 (a) and BIC2 (b) genes are shown. The mRNA levels of seedlings exposed to blue light for 120 min are labeled by blue color (Z-axis on the right). Other colors represent mRNA levels of seedlings exposed to blue light for 0, 20, 40, or 60 min (Y-axis on the left). The relative expression unit (REU) was calculated by re-normalization of the normalized qPCR signals of samples exposed to light against the normalized qPCR signal of the sample kept in the dark. PP2A (At1g69960) was used as the reference gene for qPCR normalization.
