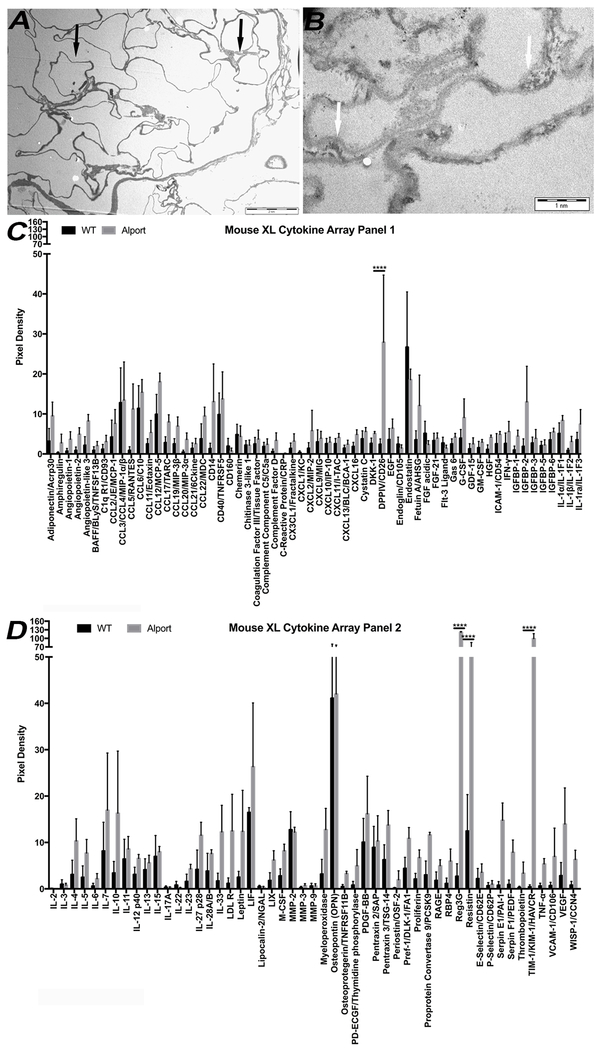
Figure 3: Transmission electron microscopy evaluation and cytokine expression analysis of WT and Alport mrECM at 7 months of age.
A-B. Representative electron transmission microscopy images of WT mrECM at 7 months (A) and Alport mrECM at 7 months (B) showing ultrastructural differences in membrane deposition between WT and Alport (arrow) and severe thinning and splitting of glomerular basement membrane (B, arrow) in Alport mrECM. Scale bar is reported in A and B.
C-D. Mouse cytokine array analysis confirming the presence of numerous cytokines within WT and Alport mrECM at 7 months of age upon homogenization. Only 4 out of 111 cytokines (CD26, REG3G, resistin and KIM1) showed to be statistically significantly different between WT and Alport samples, with Alport showing higher expression for each of them (*p<0.05, **p<0.005, ***p<0.001, ****p< 0.0001).

