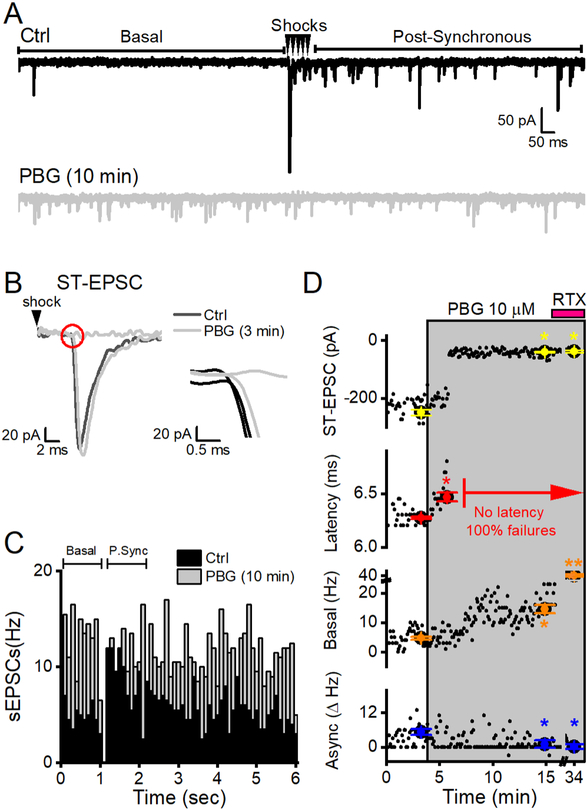
Figure 2.
PBG-induced latency shifts often culminated in ST-EPSC failures. Data are from a single representative neuron receiving a TRPV1+ afferent. A, Two overlaid sweeps from a representative neuron in control (Ctrl, black) and after 10 minutes of 10 μM PBG (grey). PBG substantially increased basal sEPSC frequency (p < 0.01, KS test) and completely blocked STEPSCs (p < 0.01, t test). Consequently, spontaneous EPSC rates in the post-synchronous time period were equivalent to rates during the basal time period (i.e., no asynchronous events). B, A representative trace of the first ST-EPSC in ctrl overlaid with 2 traces after 3 minutes of PBG exposure, just prior to complete ST-EPSC block. PBG abruptly increased the latency of STEPSCs (p < 0.01, t test), which quickly progressed into the inability of shocks (black arrowheads) to evoke a synaptic response (failures). The inset (red circle) magnifies the trace at the time of the ST-EPSC onset. C, Histogram of event timing summed in 100 ms bins over a period of 2 min (20 sweeps). In Ctrl, post-synchronous (P. Sync) sEPSCs are greater than sEPSCs in the basal time period. The pronounced difference in this rate is the asynchronous component to glutamate release (Async, Δ Hz). After 10 min, PBG increased basal sEPSC activity (p < 0.01, KS test) and completely blocked evoked ST-EPSCs (p < 0.01, t test) – resulting in a lack in asynchronous release in the post-synchronous time period (compare to figure 1C where the asynchronous component was conserved in PBG). D, A diary plot of STEPSC amplitude, latency, basal and asynchronous (async) release for this neuron. Black dots indicate data from individual sweeps while the colored dots with error bars indicate mean ± SEM from two minutes. Latency shifts were the first sign of PGB action and a complete block of the ST-EPSCs occurred shortly thereafter. PBG also increased basal frequencies and async release dropped to zero. RTX (pink bar) applied at the end of the experiment did not change the ST-EPSC amplitude from PBG because it was already blocked. As such, the lack of ST-EPSCs resulted in no measurable latencies (as indicated in red) and no asynchronous release. RTX increased spontaneous EPSC rates above both ctrl (p < 0.01, KS test) and PBG (p < 0.01, KS test, denoted as **) to confirm the afferent as TRPV1+.

