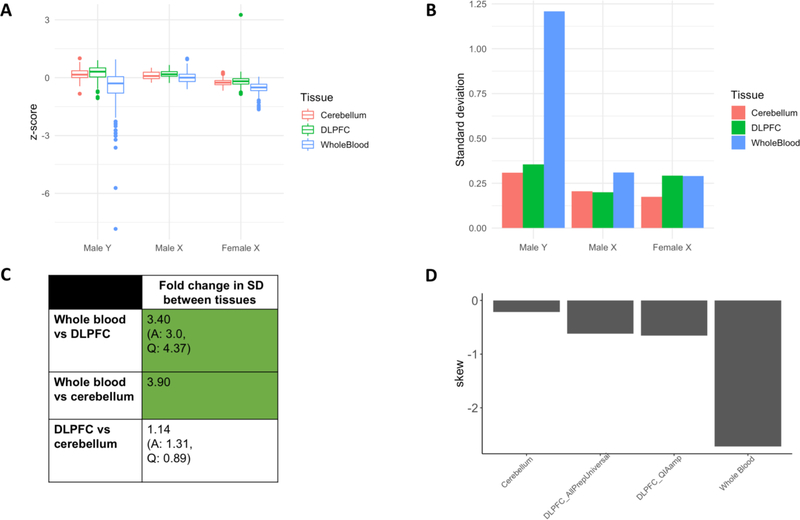
Figure 6: Relative rate and direction (hypoploidy vs hyperploidy) of chromosome Y mSA in whole blood, DLPFC and cerebellar tissues.
A) z-score distribution for the male X, female X and male Y chromosomes as measured in whole blood, DLPFC and cerebellum. B) SD of z-score distributions in A. These values were used to compute the fold change differences in C. C) Fold change in SD between tissues for the Y chromosome (FC = larger SD/smaller SD). Green shading indicates that the FC in SD between tissues was larger than the maximum SD differences attributable to extraction kit alone (referred to as FC threshold, Supplemental Figure 4B). Standard deviation in Y chromosomal content is 3.40-fold (plus or minus 2.34) higher in whole blood than in DLPFC, and 3.9-fold (plus or minus 2.34) higher than in the cerebellum. D) Skew of Y chromosome z-score distribution in whole blood, DLPFC and cerebellum. In the Y chromosome, a greater negative skew is observed in the blood than in the brain. Because distributions varied by extraction kit, we present the skew of both the AllPrepUniversal and QIAamp samples separately.

