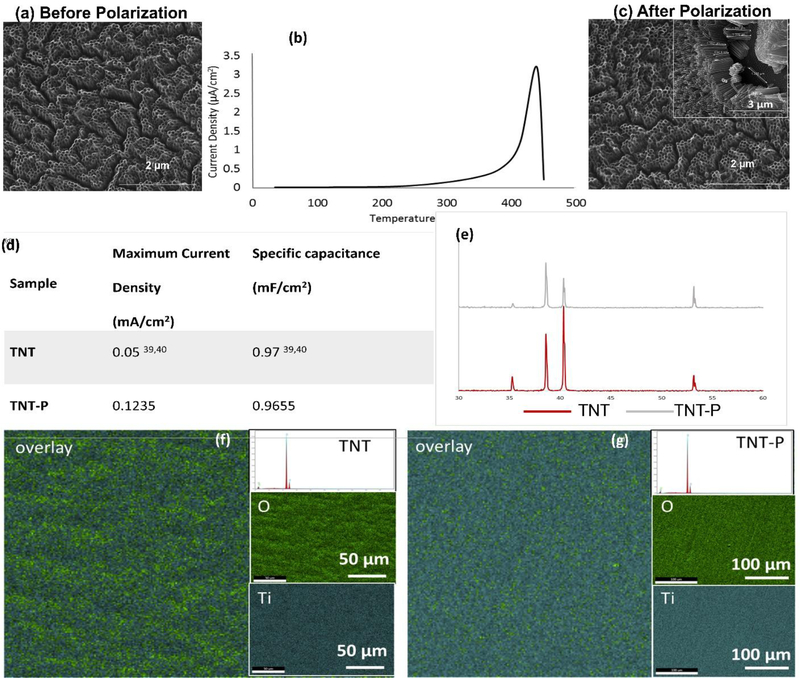
Fig. 3:
Material properties of the TNT-P. (a) and (c) show SEM micrograph of the nanoscale modification before and after the polarization was performed. No thermal degradation was noted in the nanotube array after the polarization. (b) TSDC spectrum of TNT polarized at 300°C. (d) shows comparison of specific capacitance and maximum current density values [39, 40] and (e) shows the XRD spectra of the TNT and TNT-P with no detection of secondary phases other than Ti due to the surface treatments. (g, f) represents surface chemical analysis using EDAX for TNT and TNT-P showing uniform distribution of Ti and O in the examined surface. Elemental composition spectrum shows no presence of contamination.

