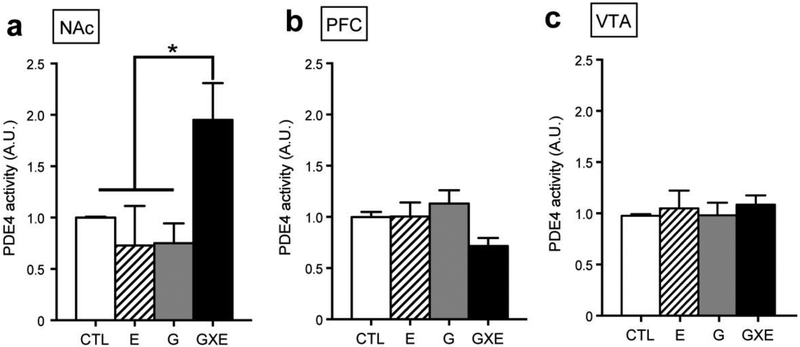
Figure 3.
Activity levels of PDE4 in the NAc, PFC, and VTA. (a) PDE4 activity was elevated in the NAc of GXE mice. *p < 0.05. n = 4 each. (b, c) There were no significant differences in PDE4 activity in the PFC (b) or VTA (c) of GXE, G, and E mice when compared with CTL mice. CTL, n = 5; E, n = 5; G, n = 4; GXE, n = 6.

