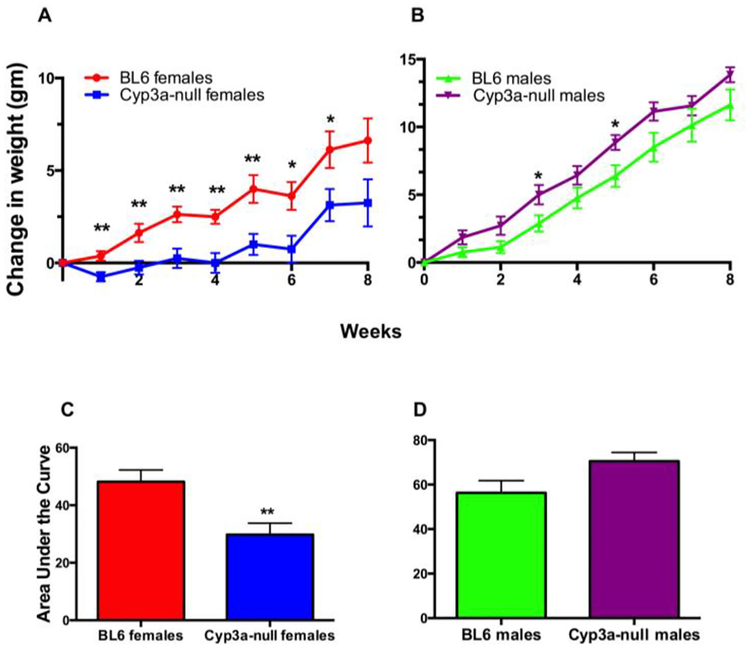
Fig. 1: Gender is crucial in the response of Cyp3a-null mice to HFD treatment in comparison to WT mice.
Change in body weight of female (A) and male (B) mice during eight-weeks of HFD-treatment. Changes in body weight are also represented as area under the curve to confirm results in females (A) and males (B). Data are presented as mean ± SEM. Statistical significance was determined by Student’s t-tests (n = 7 or 8)(* p<0.05, ** p<0.01).

