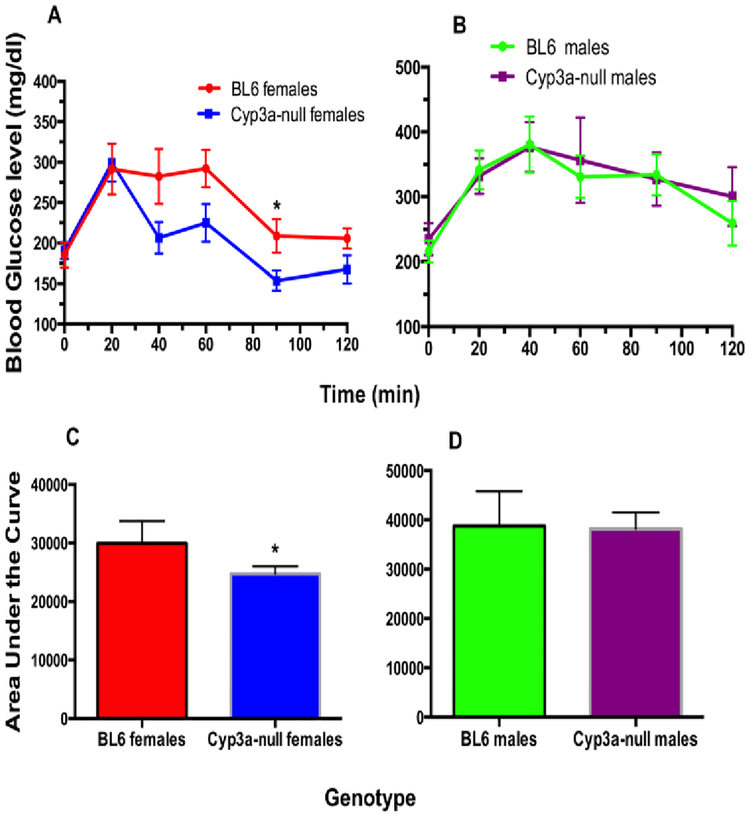
Fig. 2: Cyp3a-null female mice, but not Cyp3a-null male mice, fed a HFD show increased sensitivity to a glucose challenge in comparison to WT mice.
A GTT was performed as described in the Materials and Methods after 4-weeks of HFD-treatment in female (A) and male (B) mice. GTT results are also represented as area under the curve (AUC) to confirm results for females (C) and males (D). Data are presented as mean blood glucose levels ± SEM. Statistical significance was determined by Student’s t-tests (n = 7–8) (* p<0.05).

