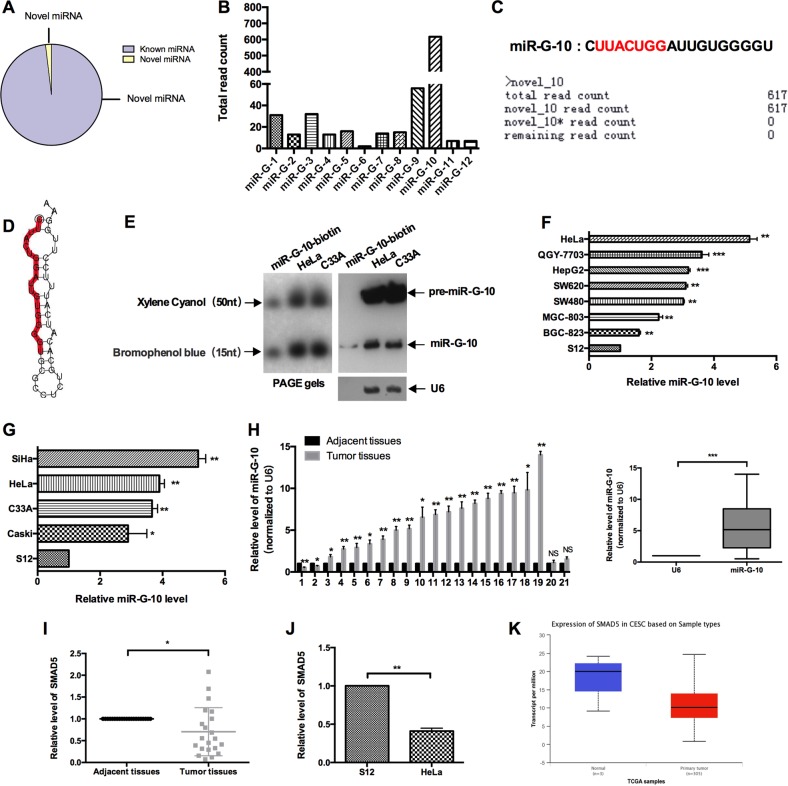
Fig. 1. Profile of GRSF1-bond miRNAs and validation of miR-G-10.
a The percentage of new miRNA and known miRNA in deep sequence results. b The read count of novel miRNAs. c The mature miRNA sequence and deep sequence data of miR-G-10. d Secondary structure prediction of miR-G-10. e Northern blot was performed using the biotin-conjugated antisense strand of miR-G-10 as a probe. The graph of PAGE gels is on the left, the top is xylene cyanol, and the bottom is bromophenol blue, representing 50 nt and 15 nt, respectively. Lane 1: 0.1pM miR-G-10-biotin probe. Lane 2: 30 μg of small RNA from HeLa cell; lane 3: 30 μg of small RNA from C33A cells. f miR-G-10 expression in different kinds of cancer cell lines. g miR-G-10 expression in various cervical cancer cell lines. h miR-G-10 expression in human cervical cancer tissues and paired adjacent tissues. i SMAD5 expression in human cervical cancer tissues and paired adjacent tissues. j SMAD5 expression in S12 cells and HeLa cells. k The expression analysis of SMAD5 in TCGA database. The expression levels were normalized to U6 snRNA. All of the experiments were repeated three times. *P < 0.05; **P < 0.01; ***P < 0.001. NS not significant

