
Figure 6.
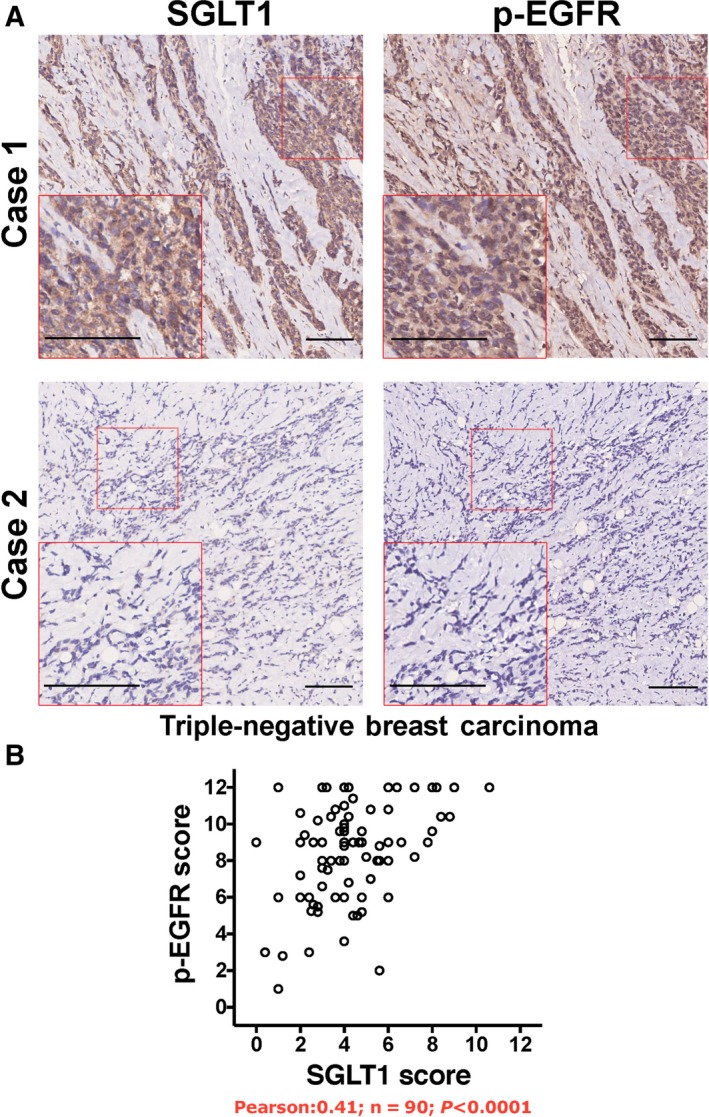
SGLT1 expression levels positively correlate with EGFR phosphorylation in TNBC. (A) Adjacent tumour sections from representative cases show SGLT1 and p‐EGFR expression in TNBC. Scale bar: 100 μm. (B) The relationship between SGLT1 expression and EGFR phosphorylation was analysed by Pearson correlation test (R = 0.41, n = 90, P < 0.0001).