
Figure 3.
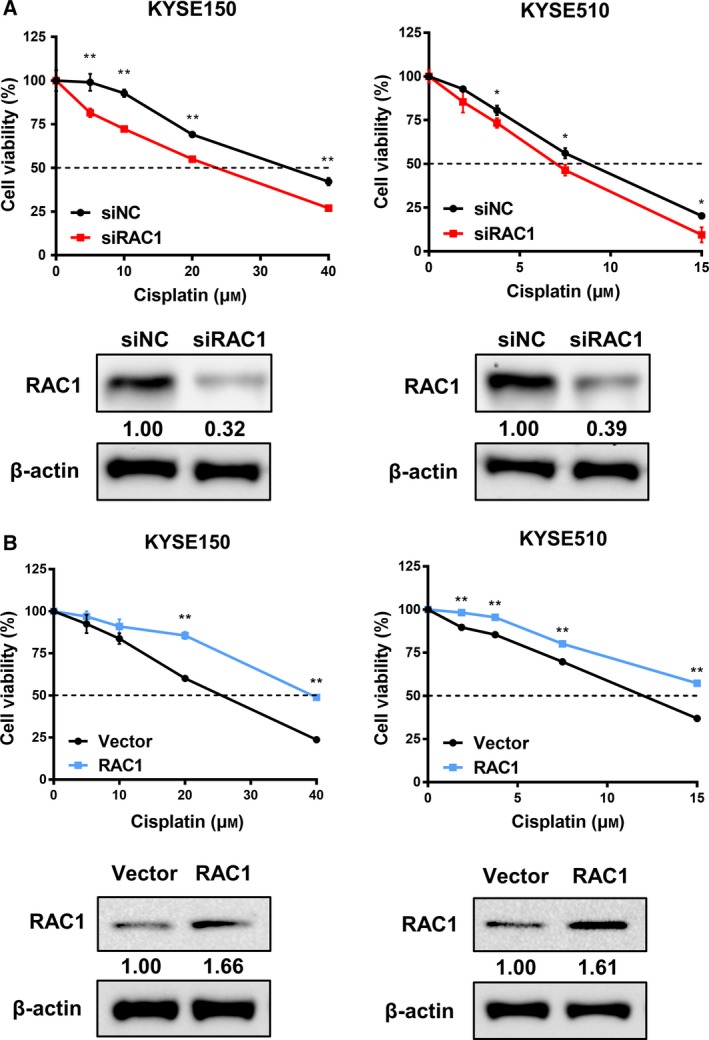
Correlation between RAC1 and cisplatin resistance in ESCC cells. (A) Chemoresistance was measured using MTS assay, and expression of protein in the siRNA‐transfected KYSE150 and KYSE510 cells was evaluated by western blot. (B) Chemoresistance was determined using MTS assay, and protein level was detected by western blot in the KYSE150 and KYSE510 cells transfected with empty vectors or RAC1 plasmids. *P < 0.05; **P < 0.01. Statistical differences were analyzed using Student’s t‐tests. Error bars represent SD from triplicate experiments.