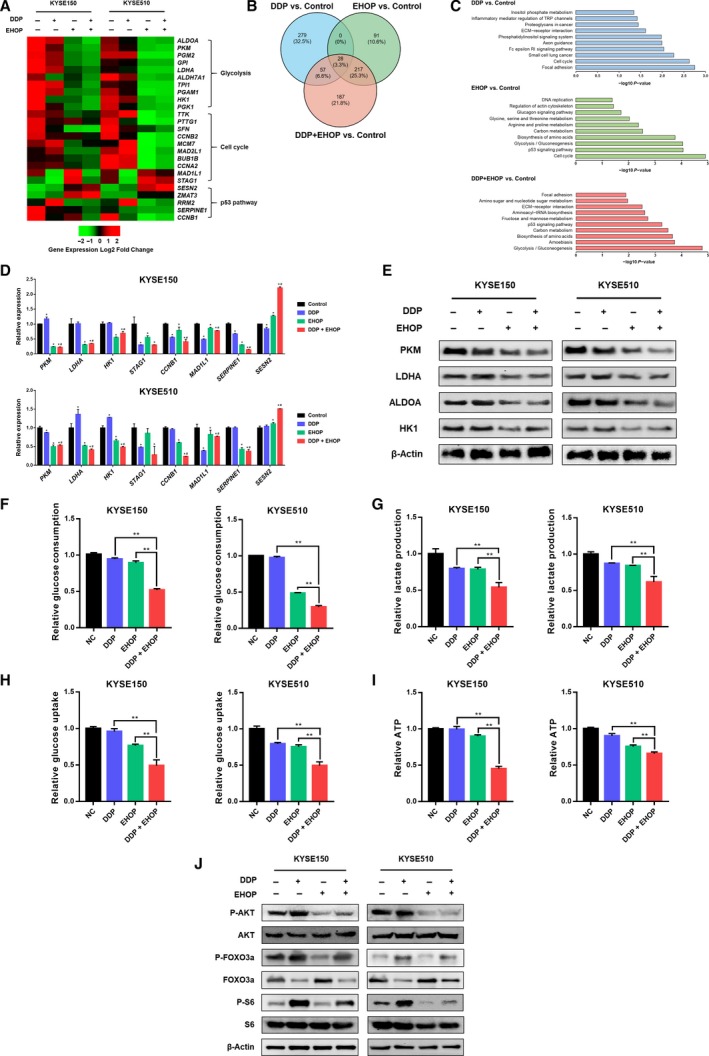
Figure 5.

Inhibition of RAC1 dampens glycolysis via inhibition of AKT signaling. (A) RNA‐seq analysis represented by a heatmap of gene expression for glycolysis, cell cycle and p53 pathway in KYSE150 and KYSE510 cells after treatment with cisplatin (DDP), EHop‐016 (EHOP), or combination therapy (DDP and EHOP) (P < 0.001, and fold change > 1.5 log2). (B) A Venn diagram demonstrates the number of differentially expressed mRNAs for cisplatin monotherapy, EHOP‐016 monotherapy, or combination therapy versus control. (C) Differentially expressed mRNAs in each treatment group versus control were categorized using GO enrichment analysis. (D) Validation of RNA‐seq data of selected genes by qRT‐PCR (*P < 0.05 vs. control; # P < 0.05 vs. cisplatin). (E) The expression of glycolytic enzymes PKM, LDHA, ALDOA, and HK1 was examined using western blot. (F) Glucose consumption in KYSE150 and KYSE510 cells after being treated with cisplatin, EHop‐016, or combination therapy. (G) Lactate production of KYSE150 and KYSE510 cells was measured under the treatment of cisplatin, EHop‐016, or combination therapy. (H) Glucose uptake was determined after KYSE150 and KYSE510 cells were treated with cisplatin, EHop‐016, or combination therapy. (I) ATP production in KYSE150 and KYSE510 cells that were treated with cisplatin, EHop‐016, or combination therapy. *P < 0.05; **P < 0.01. (J) Western blot analysis of phospho‐AKT (P‐AKT), AKT, phospho‐FOXO3a (P‐FOXO3a), FOXO3a, phospho‐S6 (P‐S6), and S6. Statistical differences were analyzed using Student’s t‐tests. Error bars represent SD from triplicate experiments.
