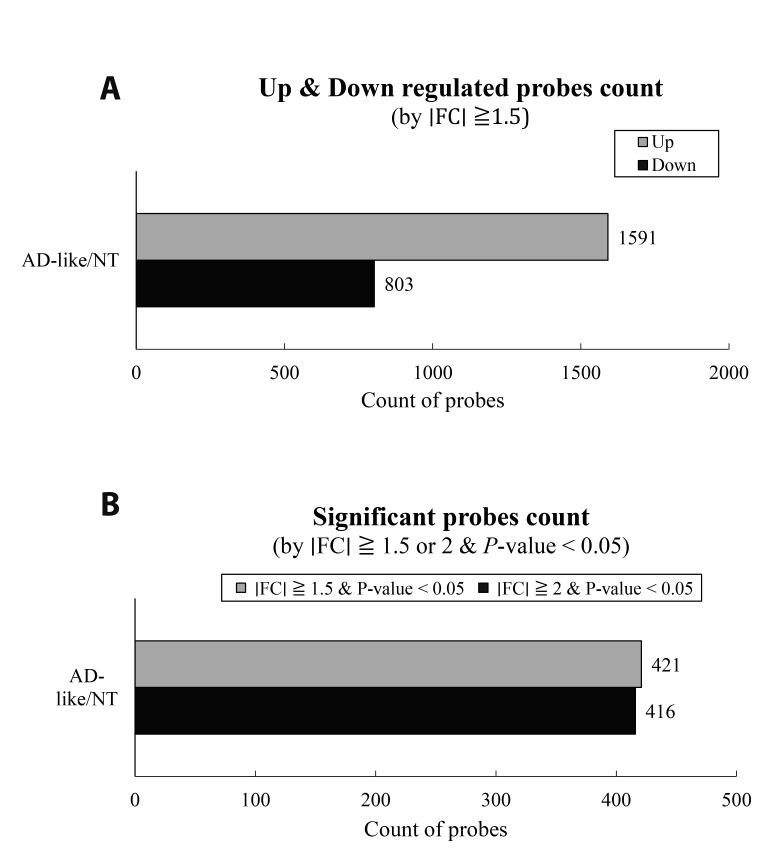
Fig. 1. Regulated probes through house dust mite-induced atopic dermatitis (AD)-like in microarray analysis by fold change (FC) and p-value.
(A) Up- and downregulated probes count compared between the AD-like (Itch) group and non-treated (NT) group (|FC| < 2). (B) Significantly regulated probes count compared between the Itch group and NT group (|FC| < 1.5 and 2 with p-value < 0.05).

