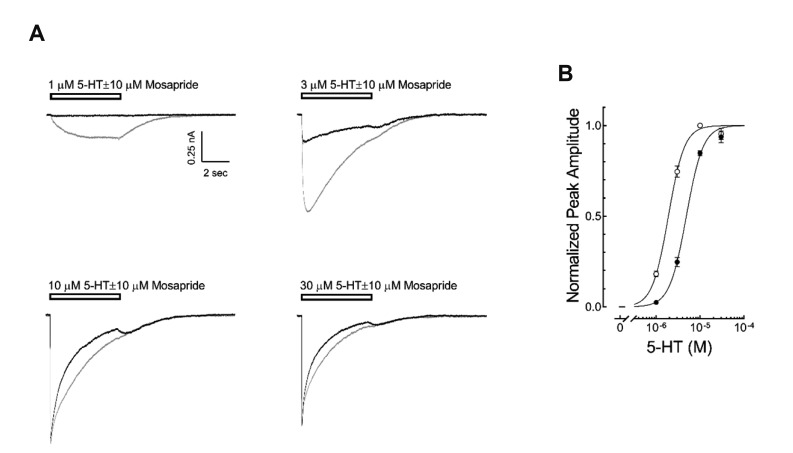
Fig. 2. Competitive inhibition of mosapride on the 5-hydroxytryptamine type 3 (5-HT3) receptor currents.
(A) Representative traces of 5-HT3 receptor currents induced by 1, 3, 10, 30 µM 5-HT in the presence (black traces) or absence of 10 µM of mosapride (gray traces), near IC50 seen in Fig. 1B. The open horizontal bars indicate the drug application period. (B) Averaged concentration-response curve of 5-HT3 receptor currents in the presence (●) or absence (○) of mosapride. The data were normalized to the peak amplitude induced by 10 µM 5-HT and lines were obtained by fitting these data to equation (1) in the Methods. The EC50 of 5-HT was increased from 1.88 ± 0.10 µM (n = 10) to 4.80 ± 0.32 µM (n = 8) by mosapride (p < 0.001, unpaired t-test) without Hill coefficient changes. There were no significant differences in the peak amplitudes induced by 30 µM 5-HT alone and the co-application of mosapride with 30 µM 5-HT (p = 0.7282, unpaired t-test). The data are expressed as means ± standard error of the mean.

