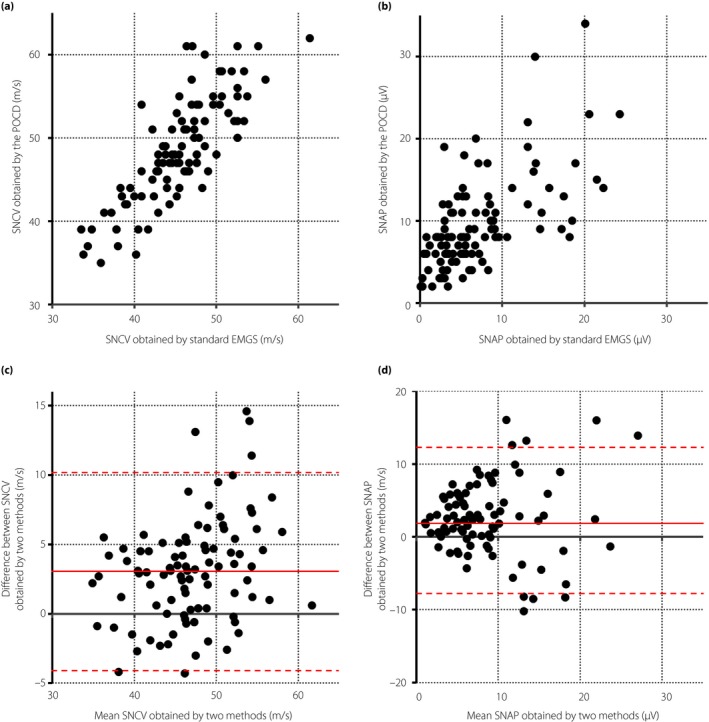
Figure 1.

Agreement analyses of nerve conduction studies between the point‐of‐care device (POCS) and standard electromyography system (EMGS) in the sural nerve. (a,b) Scatterplots of (a) sensory nerve conduction velocities (SNCVs) and (b) amplitudes of sensory nerve action potential (SNAP) between two methods. (c,d) Bland–Altman plots showing the (c) difference of SNCVs and (d) amplitudes of SNAP between two methods. The solid red lines represent the mean difference and the dotted red lines represent the upper or lower limits of the 95% confidence interval.
