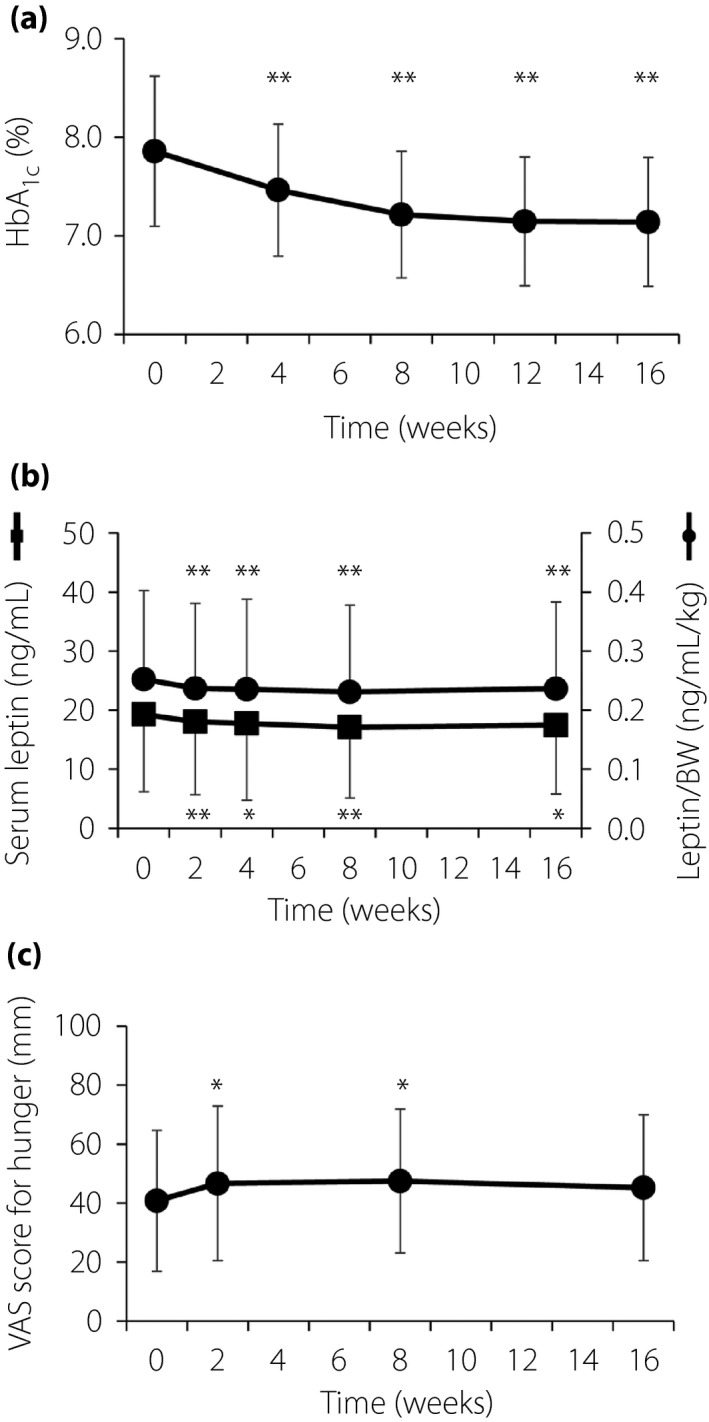
Figure 2.

(a) Time course of glycated hemoglobin (HbA1c) level during treatment with ipragliflozin. Data are the mean ± standard deviation (n = 94). **P < 0.01 versus baseline (time 0) by one‐way analysis of variance. (b) Time course of serum leptin concentration (n = 94) and the leptin/bodyweight (BW) ratio (n = 92) during treatment with ipragliflozin. Data are the mean ± standard deviation. *P < 0.05, **P < 0.01 versus baseline (time 0) by one‐way analysis of variance. (c) Time course of the visual analog scale (VAS) score for hunger (0: not hungry at all, 100: never been more hungry) during treatment with ipragliflozin. Data are the mean ± standard deviation (n = 91). *P < 0.05 versus baseline (time 0) by one‐way analysis of variance.
