Figure 2.
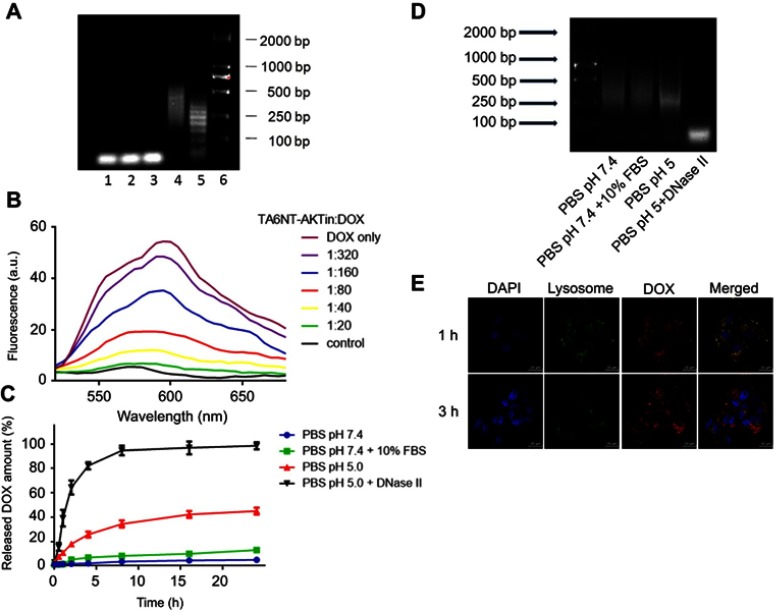
Construction and characterization of TA6NT-AKTin-DOX. (A) Agarose gel electrophoresis showing the effect of TA6-tethered trigger concentration on HCR amplification. Lanes 1–5: five different concentrations of TA6-tethered trigger (0.00, 0.10, 0.20, 0.33 and 1.00 μM) in a 1 μM mixture of M1-AKTin and M2-AKTin. Lane 6: DL2000 DNA marker. (B) Fluorescence spectra of DOX (1 μM) with increasing equivalents of TA6NT-AKTin, at DOX/TA6NT-AKTin molar ratios of 320, 160, 80, 40, 20, 0 and DOX only, respectively. The fluorescence quenching indicates DOX loading into TA6NT-AKTin. (C) In vitro release profiles of DOX at pH 7.4 containing 10% FBS, pH 7.4, 5.0 and 5.0 with DNase II. Data are mean±SD (n=3). (D) Agarose gel electrophoresis of TA6NT-AKTin-DOX at pH 7.4 containing 10% FBS, pH 7.4, 5.0 and 5.0 with DNase II for 24 hrs. (E) Fluorescence images of BCSCs treated with both LysoTracker Green and TA6NT-AKTin-DOX.

