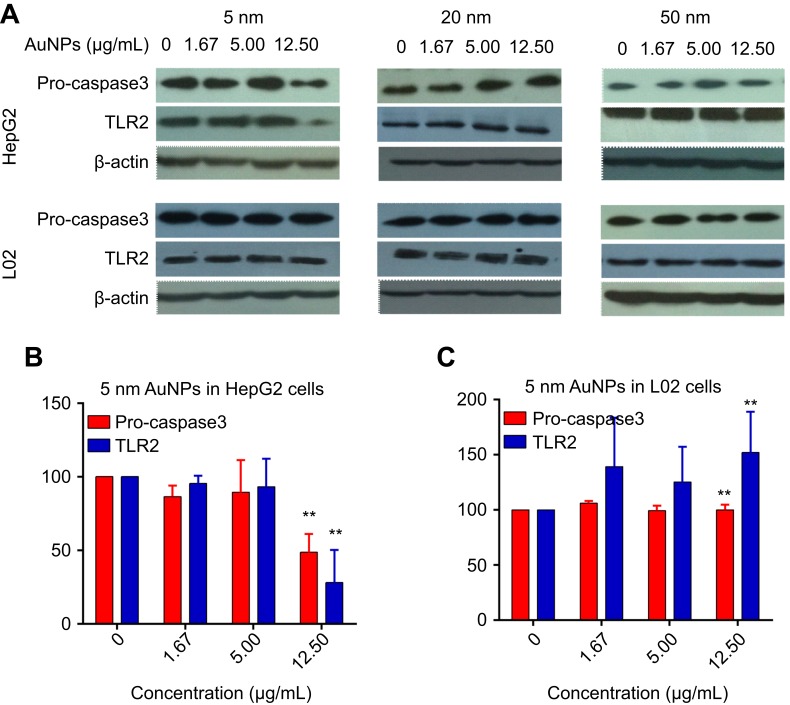
Figure 6.
The expression of Pro-caspase3 and TLR2 protein in HepG2 cells and L02 cells after 72-hr exposure of different sized gold nanoparticles (AuNPs). β-actin was used as internal control. (A) Western blot results detected by enhanced chemiluminescence and an X-ray-film exposure system. Relative densitometric value of Pro-caspase3 and TLR2 protein normalized by β-actin in HepG2 cells (B) and L02 cells (C). Data are expressed as means ± SEM of three independent experiments. **P<0.01, when compared with control.

