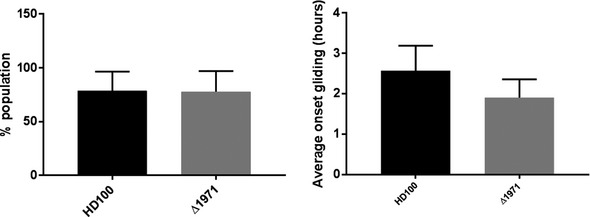
Figure EV3. Percentage of the population of cells demonstrating gliding motility.

Cells were immobilized on 1% agarose Ca/HEPES pads and imaged by phase contrast time‐lapse microscopy on a Nikon Ti‐E microscope. Time‐lapse movies were analyzed, and each cell in a field of view (FOV) was manually scored for motility (in the 6 h period of the movie) and the time from the start of the movie to first observed movement. Data are from two FOV for each of three independent experiments. n ≥ 100 for each FOV. Error bars are 1 standard deviation.Source data are available online for this figure.
