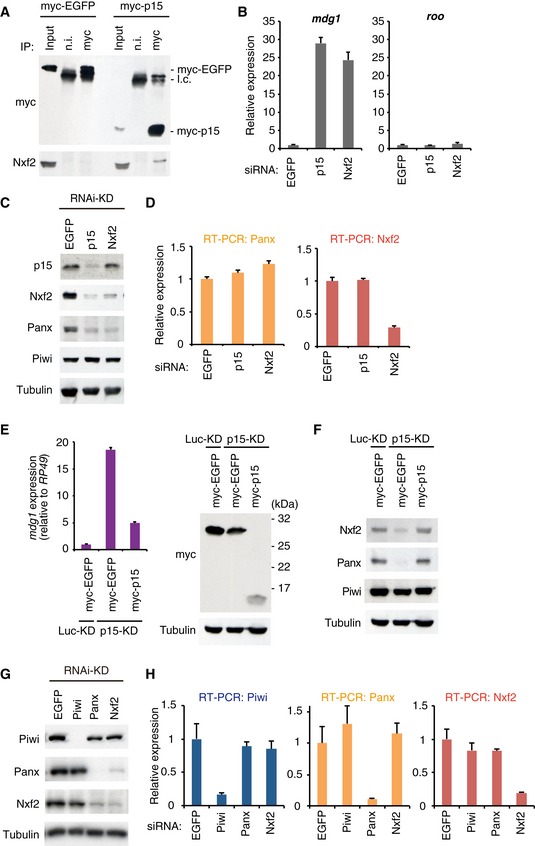
Figure 2. Panx–Nxf2–P15 complex formation is essential for the protein stability of Panx and Nxf2.

- Western blot (WB) showing Nxf2 protein levels in the complex immunoprecipitated from OSCs expressing either myc‐EGFP or myc–p15, using myc antibody. Mouse immunoglobulin G (IgG) (n.i.) was used for control immunoprecipitation.
- RNA levels of mdg1 and roo were quantified by qRT–PCR upon depletion of EGFP (control), p15, or Nxf2. Error bars indicate SD (n = 3). Note that KD was performed for 2 days with a single siRNA transfection for this experiment.
- WB showing p15, Nxf2, Panx, Piwi, and Tubulin (loading control) protein levels upon EGFP (control)‐, p15‐, or Nxf2‐KD.
- RNA levels of Panx and Nxf2 were quantified by qRT–PCR upon depletion of EGFP (control), p15, or Nxf2. Error bars indicate SD (n = 3).
- myc‐EGFP or myc–p15 was expressed in Luc‐ (control) or p15‐depleted OSCs, and mdg1 expression levels were monitored by qRT–PCR (left panel). Expression values are normalized by the expression of RP49. Error bars indicate SD (n = 3). Using the same samples, WB was performed using antibodies against myc and Tubulin (right panel).
- myc‐EGFP or myc–p15 was expressed in Luc‐ (control) or p15‐depleted OSCs, and WB was performed using antibodies against Nxf2, Panx, Piwi, and Tubulin.
- WB showing Piwi, Panx, Nxf2, and Tubulin (loading control) protein levels upon EGFP (control)‐, Piwi‐, Panx‐, or Nxf2‐KD.
- RNA levels of Piwi, Panx, and Nxf2 were quantified by qRT–PCR upon depletion of EGFP (control), Piwi, Panx, or Nxf2. Error bars represent SD (n = 3).
Source data are available online for this figure.
