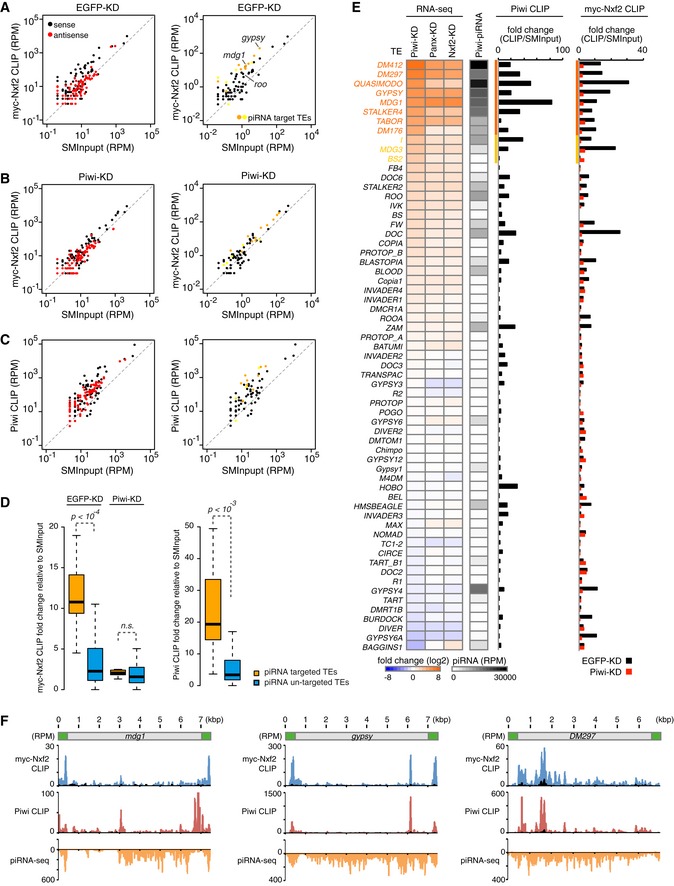
Figure 6. Nxf2 associates with nascent transcript of Piwi–piRNA‐targeted TEs.

- Scatterplot of RPM values for myc‐Nxf2 CLIP tags (y‐axis) and SMInput reads (x‐axis) mapped to TEs in EGFP (control)‐KD samples. Both x‐axis and y‐axis are log10 scales. Sense reads are plotted in black and antisense reads in red (left panel). TEs for which the expression level differed from that of the control by more than tenfold or fivefold in Piwi‐KD (Piwi–piRNA‐targeted TEs) are plotted in orange or yellow, respectively (right panel).
- Scatterplot as in (A). The plot was created using myc‐Nxf2 CLIP data from Piwi‐KD samples.
- Scatterplot as in (A). The plot was created using Piwi CLIP data. Note that RNAs used for creating Piwi CLIP libraries are in the size range of 43–73 nt, and therefore, piRNAs are excluded.
- Boxplots showing fold changes of the indicated CLIP tags to SMInput, for Piwi–piRNA‐targeted and un‐targeted TEs. Piwi–piRNA‐targeted TEs are defined based on RNA‐seq analysis (Fig 1). Reads mapped to sense direction of indicated TEs were used for calculation of CLIP tag fold change, and TEs with SMInput signal under 0.5 RPM were eliminated. Boxplot central bands, boxes, and whiskers show median, third quartile, first quartile, maxima, and minima, respectively. P‐values were calculated by the Wilcoxon rank‐sum test. n.s., not significant, P > 0.01.
- Heatmaps displaying fold changes of TE expression with indicated siRNA knockdown (normalized to EGFP‐KD), and Piwi‐associated piRNA levels obtained from small RNA‐seq (RPM). The CLIP‐seq diagram indicates fold changes of Piwi CLIP tags, and myc‐Nxf2 CLIP tags relative to SMInput, obtained upon EGFP‐ or Piwi‐KD. Reads mapped to sense direction of indicated TEs were used for calculation of CLIP tag fold change, and TEs with SMInput signal under 0.5 RPM were eliminated. Piwi‐bound piRNA levels were determined by using reads mapped to antisense of the indicated TEs. TEs for which the expression level differed from that of the control by more than tenfold or fivefold in Piwi‐KD (Piwi–piRNA‐targeted TEs) are indicated in orange or yellow, respectively.
- Density plots for myc‐Nxf2 CLIP tags (blue plots), Piwi CLIP tags (red plots), and Piwi–piRNA reads (orange plots) over the consensus sequence from mdg1, gypsy, and DM297 (Piwi–piRNA target TEs). The LTR region of each TE is illustrated in green. SMInput is overlaid in black at each plot; y‐axis has been adjusted to 100 for the plot of Piwi CLIP tags mapped to mdg1.
