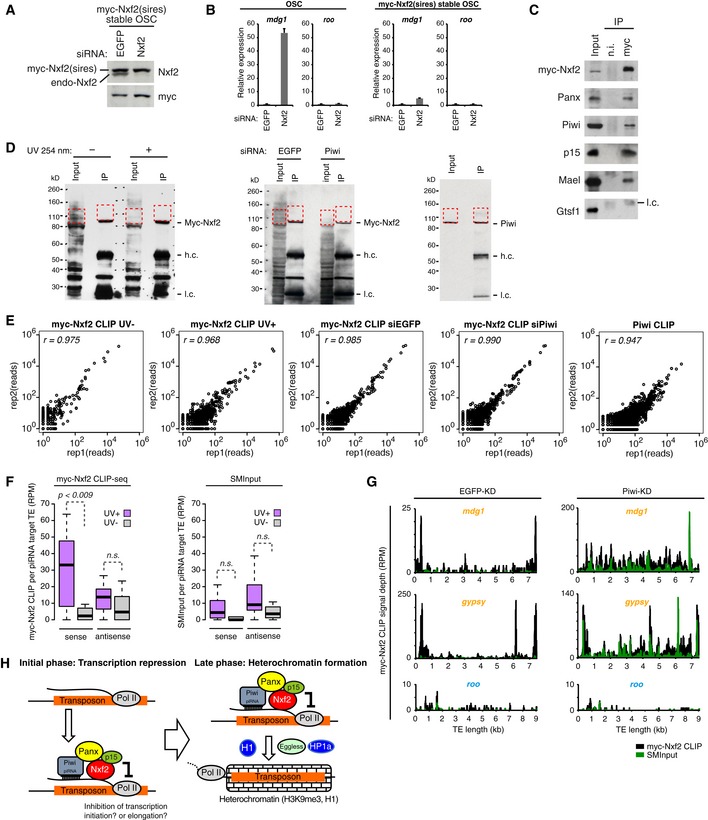
Western blotting (WB) of myc‐Nxf2 stable OSC lysate, using Nxf2 and myc antibody upon knockdown of EGFP (control) or Nxf2. Note that expressed myc‐Nxf2 is resistant to siRNA.
RNA levels of mdg1 and roo were quantified by qRT–PCR upon depletion of EGFP (control) or Nxf2. Expression levels are normalized by the expression of RP49. Error bars represent SD (n = 3). In OSCs without myc‐Nxf2 expression, mdg1 is de‐silenced upon Nxf2‐KD, whereas in the myc‐Nxf2‐expressing stable line, mdg1 remains silenced.
Immunoprecipitation (IP) from myc‐Nxf2‐expressing OSC lysate using anti‐myc antibody, followed by WB of myc‐Nxf2 (by myc antibody), Panx, Piwi, p15, Mael, and Gtsf1. l.c.: light chain from the antibody.
WB of myc‐Nxf2 IP during CLIP from non‐irradiated or UV‐irradiated cells (left panel). WB of myc‐Nxf2 IP during CLIP from EGFP or Piwi knockdown cells (middle panel). WB of Piwi IP during CLIP (right panel). Red dotted line indicates the region excised for CLIP library preparation.
Scatter plots of obtained CLIP reads in two biological replicates of indicated CLIP experiments. Each dot represents the read count of the peak called using the Piranha peak‐calling algorithm (Uren
et al,
2012).
Boxplots showing piRNA‐targeted TE‐mapped read counts (RPM) obtained from myc‐Nxf2 CLIP or SMInput, based on CLIP‐seq performed on UV‐irradiated and non‐irradiated OSCs. Reads mapped in sense and antisense directions were calculated separately. Boxplot central bands, boxes, and whiskers show median, third quartile, first quartile, maxima, and minima, respectively. P‐values were calculated by Wilcoxon rank‐sum test.
Density plots for myc‐Nxf2 CLIP signal depth over the consensus sequence from mdg1, gypsy (targeted by Piwi–piRNA, in orange letters), and roo (not targeted by Piwi–piRNA, in blue letters) TEs in EGFP‐, Piwi‐KD OSCs. Reads obtained in myc‐Nxf2 CLIP samples are indicated in black, where SMInput is indicated in green.
Schematic model showing the two‐phase regulation of TEs by Piwi–piRISC. Nxf2 forms a complex with Panx, Piwi, and p15 and associates with nascent RNA of target transposable elements. This complex regulates transcription of the TE by the inhibition of Pol II (initial phase). The co‐transcriptionally regulated TE shifts to heterochromatin formation, mediated by H3K9me3 marks and H1 (late phase).

