
Figure 4. Microglia dynamics depend on distance to Aβ deposition in APP/PS1 mice.
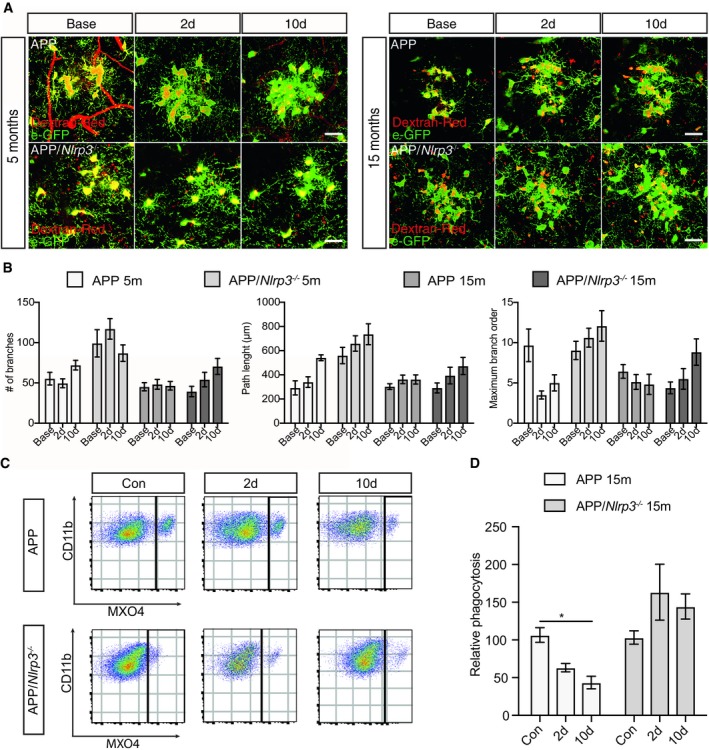
- Two‐photon images of microglia (eGFP) cells clustering around amyloid plaque for APP and APP/Nlrp3 −/− (5 and 15 months old). Scale bar: 20 μm.
- Quantification of morphological parameters in (A) (mean of 5–6 ± SEM).
- Flow cytometry plots from APP and APP/Nlrp3 −/− mice (15 months old), cells were gated on CD11b and MXO4 after microglia isolation.
- Relative Aβ microglia uptake quantification (mean of 5 ± SEM; two‐way ANOVA followed by Tukey's post hoc test, *P < 0.05).