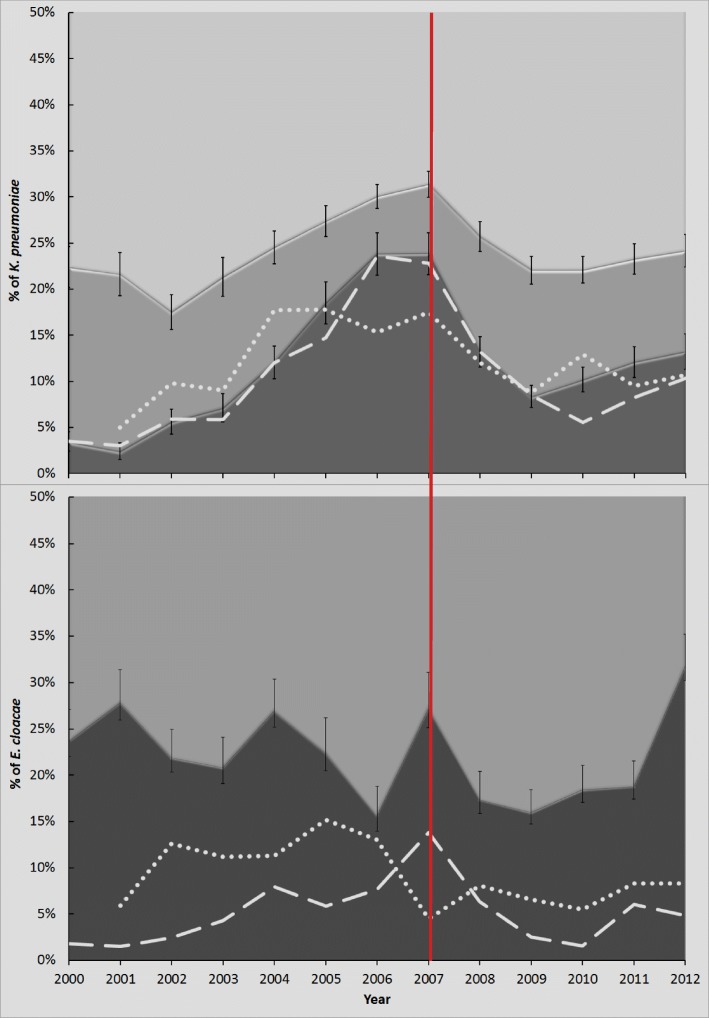
Fig. 1.
Trends in drug resistance amongst K. pneumoniae and Enterobacter spp. isolated from patients attending CUH between 2000 and 2012. The proportion of a Klebsiella pneumoniae and b Enterobacter spp. resistant to one group of antimicrobials or less (pale shading), two groups (mid-shading), or three or more groups (dark shading) are shown, and a major change in national antimicrobial prescribing practice in 2007 is denoted with a red vertical line. Black vertical lines represent 95% confidence intervals. Resistance to cephalosporins and/or aminoglycosides in K. pneumoniae or aminoglycosides in E. cloacae is shown for isolates from Cambridge alone (dashed white line) and the UK (dotted white lines) (UK data from www.bsacsurv.org)

