
Figure 1.
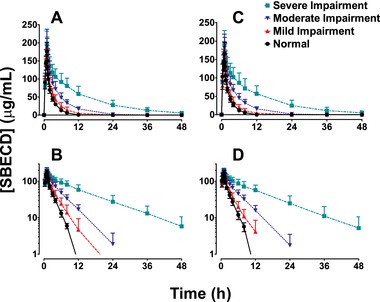
Mean (SD) plasma concentration‐time profiles in subjects with varying degrees of renal function after IV infusion of 2400 mg SBECD from either 300 mg IV delafloxacin (panels A and B) or IV placebo (panels C and D). Upper panels (A and C), linear scale. Lower panels (B and D), semi‐log scale. IV indicates intravenous; SBECD, sulfobutylether‐β‐cyclodextrin.