
Figure 3.
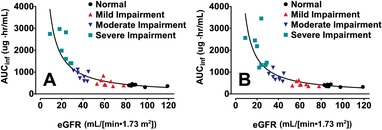
AUCinf vs eGFR after IV dosing of 2400 mg SBECD from either 300 mg IV delafloxacin (A) or IV placebo (B). Solid lines are hyperbolic line regressions. AUCinf indicates area under the concentration‐time curve to infinity; eGFR, estimated glomerular filtration rate; IV, intravenous; SBECD, sulfobutylether‐β‐cyclodextrin.