Figure 3.

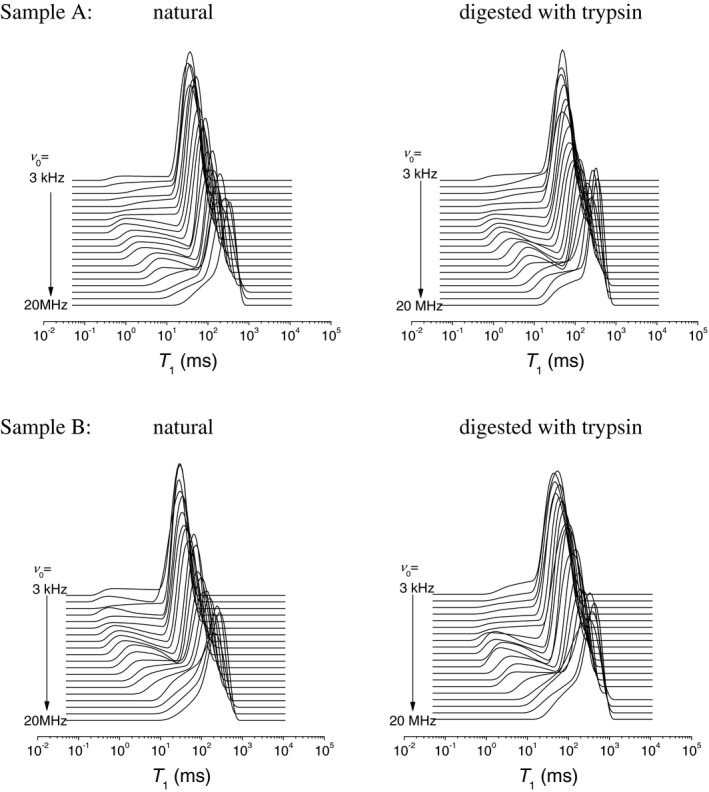
Representative T1 distributions in bovine articular cartilage before and after trypsin digestion, at different magnetic field strengths, indicated by their Larmor frequencies ν 0

Representative T1 distributions in bovine articular cartilage before and after trypsin digestion, at different magnetic field strengths, indicated by their Larmor frequencies ν 0