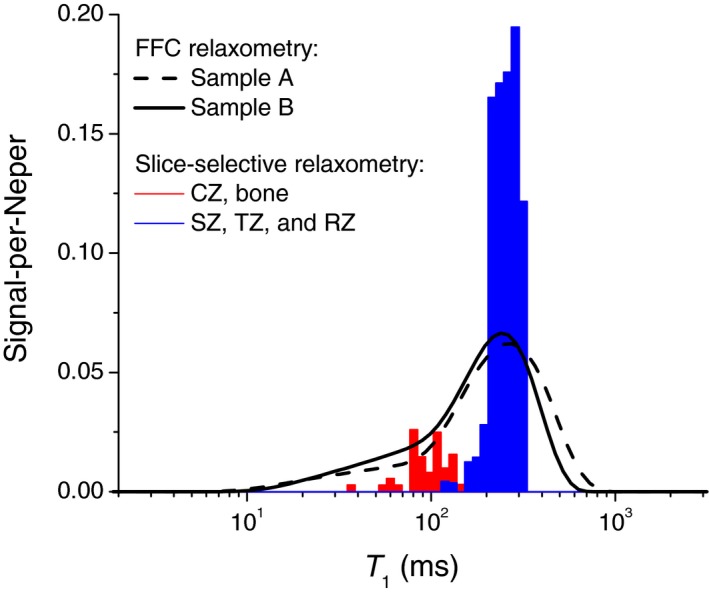
Figure 4.

Comparison of the T1 distribution measurements from FFC relaxometry (the solid and dashed lines) and slice‐selective relaxation data presented in Figure 1. The experiments were carried out at ν 0 = 12.5 MHz and 11.7 MHz, respectively. To plot a histogram based on the slice‐selective data, the counts of T1 were weighted using a corresponding NMR signal intensity profile.14 The contribution from the calcified zone and the underlying bone is highlighted in red
