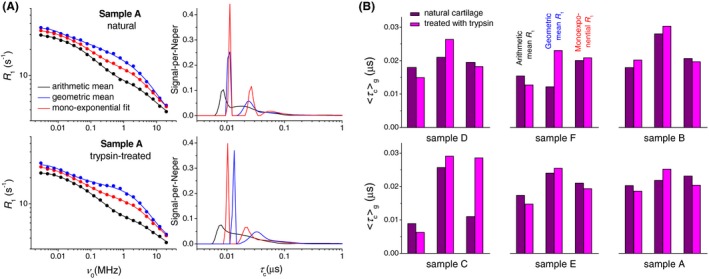
Figure 7.

A, Dispersion profiles of three estimates of an average relaxation rate R 1—the reciprocal of the arithmetic mean T1, of the geometric mean T1, and of the best‐fit single‐exponential decay rate. The solid lines represent the multi‐Lorentzian models (Equation 4), which are plotted using the correlation time distributions shown on the right. B, Mean correlation times computed from the given for each of the three R1 estimates. The means based on the values (see the blue profiles) consistently increase after the trypsin digestion of cartilage
