Figure 4.

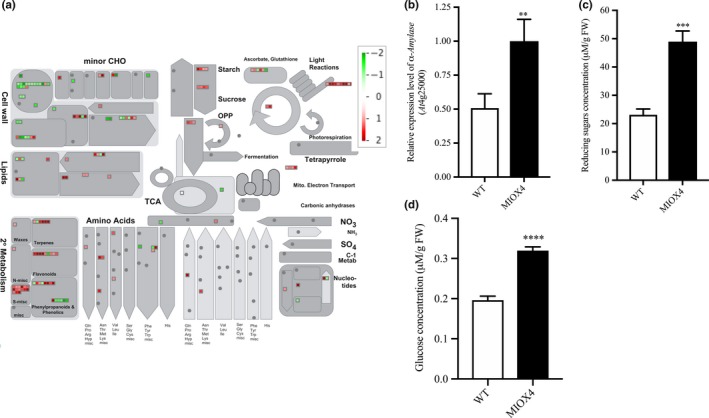
Carbohydrate metabolism is enhanced in the high ascorbate line. (a) The overall effect of MIOX4 OE in primary and secondary metabolisms. Figure was obtained using MapMan 3.5.1 R2. Up‐regulated transcripts are indicated by red, while down‐regulated transcripts are indicated in green. (b) α‐Amylase was significantly up‐regulated in MIOX4 OE compared to WT as shown by RT‐qPCR. Data are means ± SEM (n = 3). (c) Reducing sugars concentration was significantly higher in MIOX4 OE line compared to WT as shown by DNS assay. D) Glucose concentration was significantly higher in MIOX4 OE line compared to controls as shown by GOD‐POD assay. **Indicates p < .01, ***indicates p < .001 and ****indicates p < .0001 at 0.05 significance level. DNS = Di‐nitrosalicylic acid, GOD‐POD = glucose oxidase–glucose peroxidase. Data are means ± SEM of three replicates for RT‐qPCR and six replicates for DNS and GOD‐POD assays
