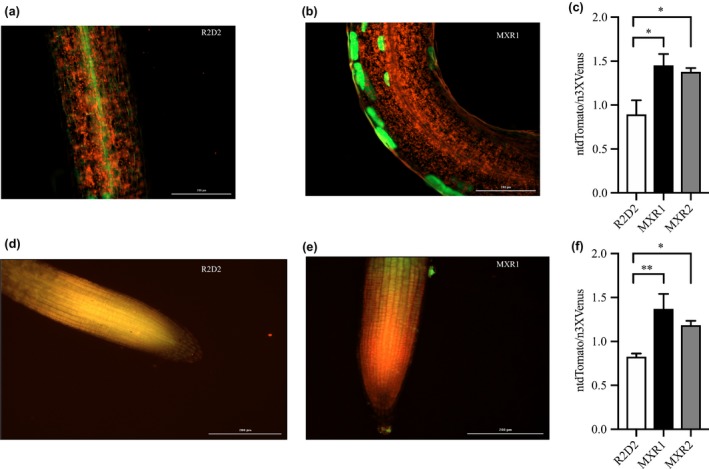
Figure 7.

In vivo visualization and semi‐quantification of auxin response in AtMIOX4 × R2D2 crosses. (a–c) The ntdTomato expression was significantly higher in MIOX4 × R2D2 crosses compared to R2D2 control in shoots. (d–f) The ntdTomato expression was significantly higher in MIOX4 × R2D2 crosses compared to R2D2 control in roots. ntdTomato = red, DII‐venus = green. Data are means ± SEM (n = 4). Scale bars = 200 μm. Data were analyzed using one‐way ANOVA and multiple comparisons were performed comparing crosses with controls using Dunnett's multiple comparisons test at 0.05 significance level. *Indicates p < .05 and **indicates p < .01
