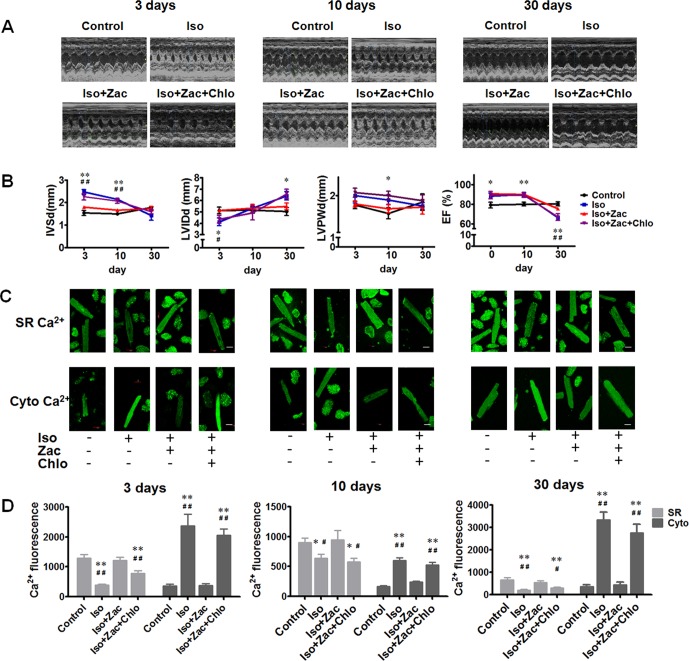
Figure 3.
Time courses of structural remodeling and electrical remodeling 3 days, 10 days, and 30 days post-Iso infusion. (A) Representative echocardiographic images of the corresponding hearts. (B) Time courses of IVSd, LVIDd, LVPWd, and EF changes post-Iso toxication. *P < 0.05, **P < 0.01 for Iso compared with age-matched control. #P < 0.05, ##P < 0.01 for Iso compared with age-matched Iso+Zac group. (C) Cytosolic Ca2+ and SR Ca2+ fluorescences measured using laser scanning confocal microscopy. Upper row, Fluo-5N cellular distribution indicating SR Ca2+. Lower row, Fluo-4 cellular distribution indicating cytosolic Ca2+. Scale bars = 20 µm. (D) Statistical summary of cytosolic Ca2+ and SR Ca2+ levels of 3 days, 10 days, and 30 days post-Iso exposure, respectively. SR, sarcoplasmic reticulum. LVIDd, left ventricular dimension in end diastole. IVSd, interventricular septum end-diastolic thickness. LVPWd, LV posterior wall thickness at end diastole; EF, ejection fraction; Iso, isoproterenol; Zac, zacopride; Chlo, chloroquine; RS23597, RS23597-190; m-CPBG, m-chlorophenylbiguanide. Data are presented as mean ± SEM. *P < 0.05, **P < 0.01 compared with age-matched control. #P < 0.05, ##P < 0.01 compared with age-matched Iso+Zac.

