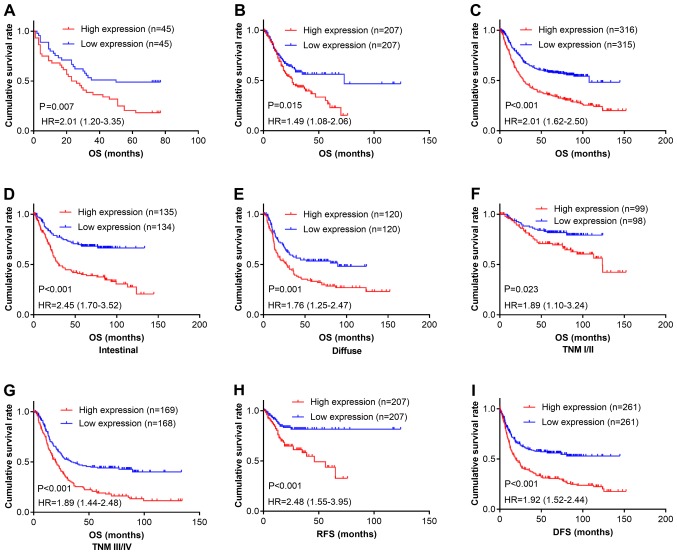
Figure 2.
CPXM2 overexpression in GCs is associated with poor patient survival. (A-C) Kaplan-Meier plots for OS of patients in the TMA cohort (A), TCGA cohort (B) and Kaplan-Meier Plotter cohort (C). (D-G) Kaplan-Meier plots for OS of patients with intestinal type (D), diffuse type (E), early stage (F), and late stage (G) GC in the Kaplan-Meier Plotter cohort. (H and I) Kaplan-Meier plots for RFS of patients in the TCGA cohort (H) and Kaplan-Meier Plotter cohort (I). Patients were stratified into low and high CPXM2 expression groups according to CPXM2 mRNA expression (< median vs. ≥ median) in the TCGA and Kaplan-Meier Plotter cohorts, or H scores of CPXM2 staining (< median vs. ≥ median) in the TMA cohort. P-values were obtained using the log-rank test. Censored data are indicated by the + symbol. CPXM2, carboxypeptidase X, M14 family member 2; DFS, disease-free survival; GC, gastric cancer; HR, hazard ratio; NT, adjacent normal tissue; OS, overall survival; RFS, recurrence-free survival; TCGA, The Cancer Genome Atlas; TMA, tissue microarray; TNM, tumor node metastasis.

