Figure 1.
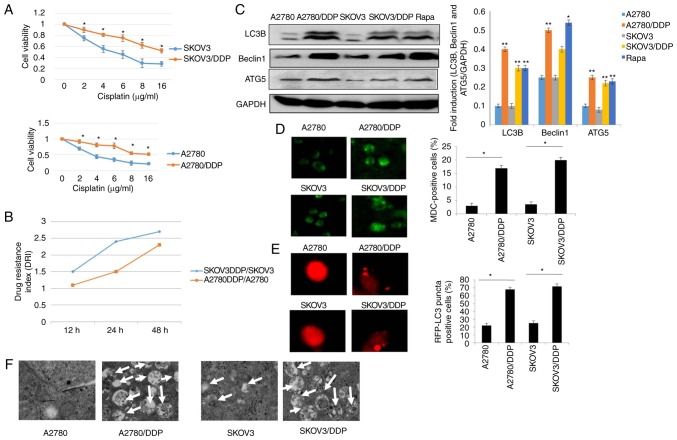
Autophagy is induced in cisplatin-resistant human ovarian cancer cell lines. (A) A2780, A2780/DDP, SKOV3 and SKOV3/DDP cells were incubated with the indicated concentrations of cisplatin for 24 h, and cell viability was then measured by CCK-8 assay. Values were presented as the mean ± SEM (n=3). *P<0.05, statistical significance vs. normal A2780 and SKOV3 cells. (B) Drug resistance index (DRI) of cisplatin in A2780, A2780/DDP, SKOV3 and SKOV3/DDP cells. (C) The levels of LC3, Beclin1 and ATG5 were detected by western blot analysis in A2780, A2780/DDP, SKOV3 and SKOV3/DDP cells. Rapamycin (Rapa) was used as a positive control. GAPDH served as a loading control. Results were repeated in independent experiments. *P<0.05 and **P<0.01, statistical significance vs. normal A2780 and SKOV3 cells. (D) MDC staining of A2780, A2780/DDP, SKOV3 and SKOV3/DDP cells. *P<0.05, statistical significance vs. normal A2780 and SKOV3 cells. (E) A2780, A2780/DDP, SKOV3 and SKOV3/DDP cells were transfected with GFP-RFP-LC3-plasmid. After 24 h, representative images of GFP- RFP-LC3-II-positive puncta were photographed by using a confocal fluorescence microscope. *P<0.05, statistical significance vs. normal A2780 and SKOV3 cells. (F) The ultrastructural changes of A2780, A2780/DDP, SKOV3 and SKOV3/DDP cells as measured by transmission electron microscopy are shown. The white arrows indicate the typical images of autophagosomes and autolysosomes.

