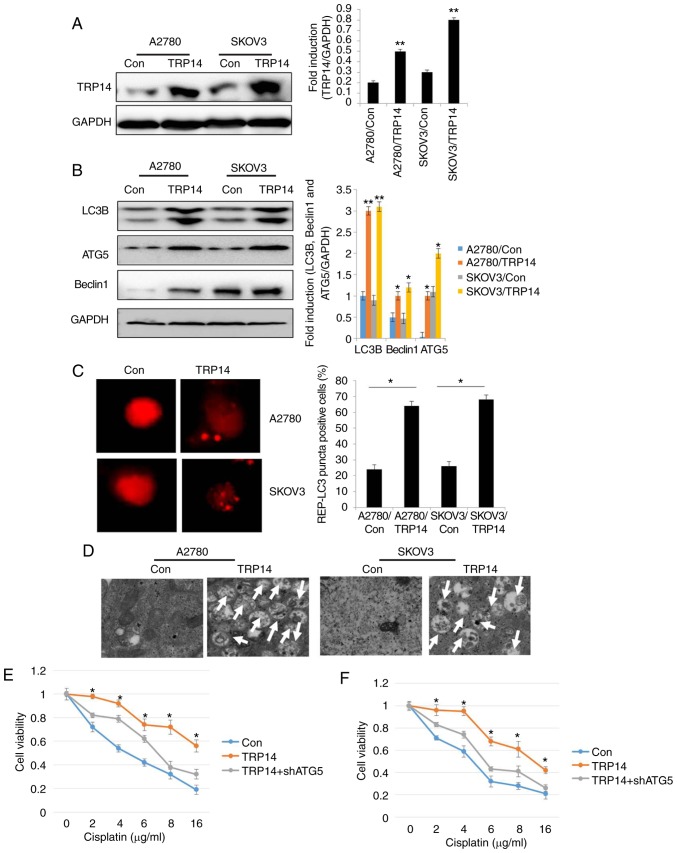
Figure 4.
TRP14 overexpression promotes autophagy and cisplatin resistance in human ovarian cancer cells. (A) The levels of TRP14 were detected by western blot analysis in A2780 and SKOV3 cells by the overexpression of TRP14. **P<0.01 indicates statistical significance vs. control cells. (B) Autophagy-associated genes (LC3, Beclin1 and ATG5) were examined in A2780 and SKOV3 cells following TRP14 overexpression. *P<0.05 and **P<0.01, statistical significance vs. control cells. (C) Overexpression of TRP14 in A2780 and SKOV3 cells and then cells were transfected with GFP-RFP-LC3-plasmid overnight. Representative images of GFP- RFP-LC3-II-positive puncta were obtained using a confocal fluorescence microscope. *P<0.05, statistical significance vs. control cells. (D) Autophagosome and autolysosome vesicles of A2780 and SKOV3 cells following the overexpression of TRP14 were visualized by transmission electron microscopy. The white arrows indicated typical images of autophagosomes and autolysosomes. (E) TRP14-overexpressing SKOV3/DDP cells were transfected with or without ATG5 shRNA. The cells were then treated with the indicated concentrations of cisplatin (from o to 16 µg/ml) for 24 h and cell viability was measured by CCK-8 assay. The Kruskal-Wallis was used for multiple comparisons and then Mann Whitney U test and Bonferroni's correction were applied. The values are presented as the means ± SEM (n=3). *P<0.05, statistical significance vs. TRP14-overexpressing cells. (F) TRP14-overexpressing A2780 cells were transfected with or without ATG5 shRNA. The cells were then treated with the indicated concentrations of cisplatin (from o to 16 µg/ml) for 24 h and cell viability was measured by CCK-8 assay. The Kruskal-Wallis was used for multiple comparisons and then Mann Whitney U test and Bonferroni's correction were applied. The values are presented as the means ± SEM (n=3). *P<0.05, statistical significance vs. TRP14-overexpressing cells.

