Figure 5.
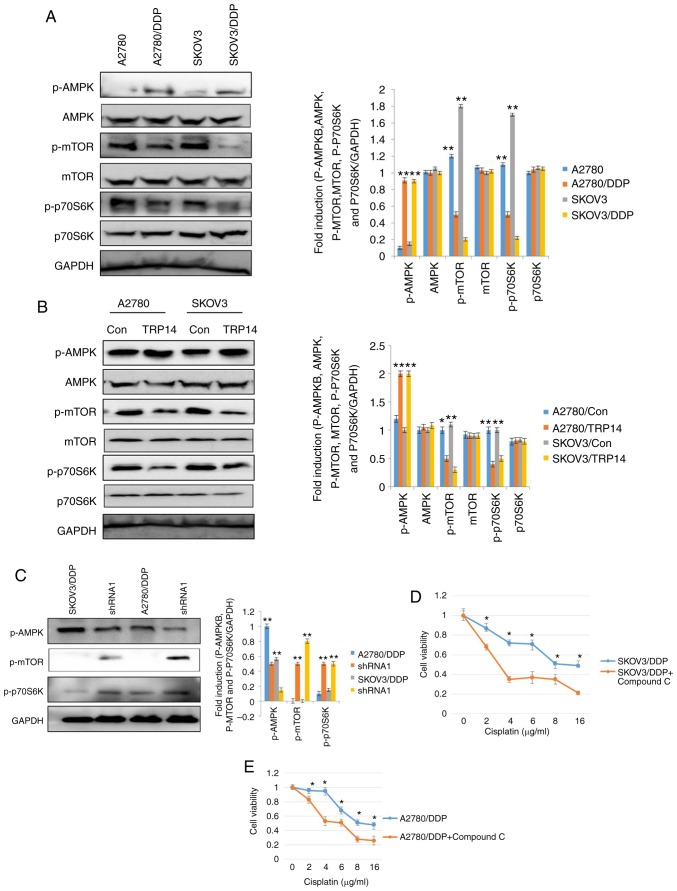
TRP14 induces autophagy and chemoresistence via the AMPK/mTOR/p70S6K signaling pathway. (A) The phosphorylation levels of AMPK, mTOR and p70S6K were detected by western blot analysis in A2780/DDP and SKOV3/DDP cells. **P<0.01, statistical significance vs. normal A2780 and SKOV3 cells. (B) The phosphorylation levels of p-AMPK, p-mTOR and p70S6K were detected by western blot analysis in SKOV3 and A2780 cells following the overexpression of TRP14. *P<0.05 and **P<0.01, statistical significance vs. normal A2780 and SKOV3 cells. (C) The phosphorylation levels of p-AMPK, p-mTOR and p70S6K were detected by western blot analysis in A2780/DDP and SKOV3/DDP cells following TRP14 knockdown. **P<0.01, statistical significance vs. TRP14-knockdown cells. (D) SKOV3/DDP cells were treated with 4 µM compound C for 12 h. The cells were then treated with the indicated concentrations of cisplatin and cell viability was measured by CCK-8 assay. Values are presented as the means ± SEM (n=3). *P<0.05, statistical significance vs. compound C-treated cells. (E) A2780/DDP cells were treated with 4 µM compound C for 12 h. The cells were then treated with the indicated concentrations of cisplatin and cell viability was measured by CCK-8 assay. Values are presented as the means ± SEM (n=3). *P<0.05, statistical significance vs. compound C-treated cells.

