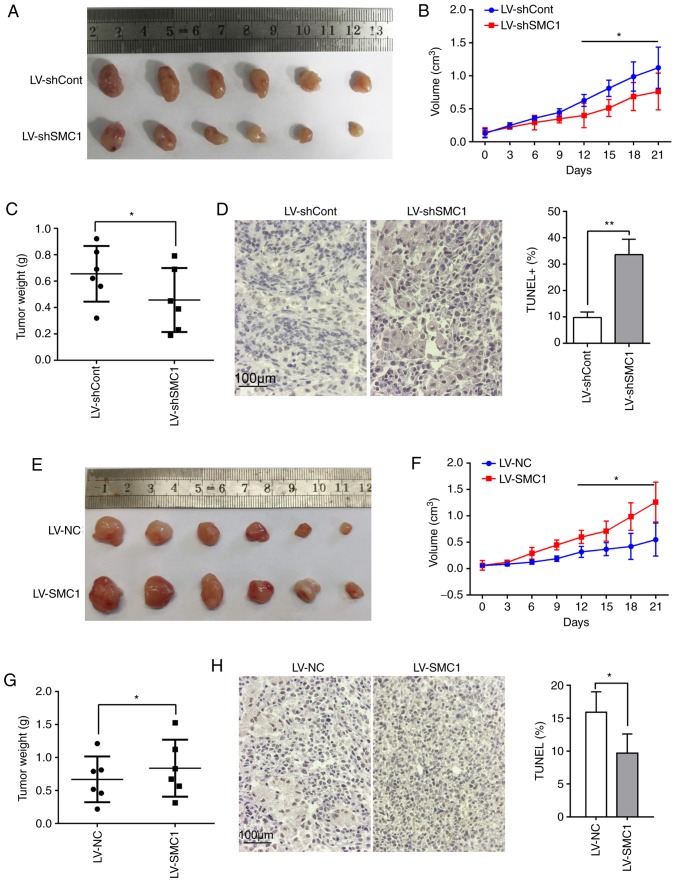
Figure 4.
SMC1 promotes cell proliferation in vivo. (A) Final tumor volume of SW620 cell xenografts. The largest tumor (upper left) has a diameter of 13 mm. (B) Tumor growth curves of xenograft nude mice. Tumor volume was measured every 3 days. (C) After 21 days, the tumor weight was calculated. (D) TUNEL staining of the tumors. The apoptotic index as determined by the percentage of TUNEL-stained nuclei was calculated. (E) Final tumor volume of SW480 cell xenografts. The largest tumor (lower left) has a diameter of 14 mm. (F) Tumor growth curves of xenograft nude mice. Tumor volume was measured every 3 days. (G) After 21 days, tumor weight was calculated. (H) TUNEL staining of the tumors. The apoptotic index as determined by the percentage of TUNEL-stained nuclei was calculated. Data are presented as the mean ± SD from separate experiments. *P<0.05, **P<0.01. Cont, control; LV, lentivirus; NC, negative control; sh, short hairpin (RNA); SMC1, structural maintenance of chromosomes 1.

