Figure 2.
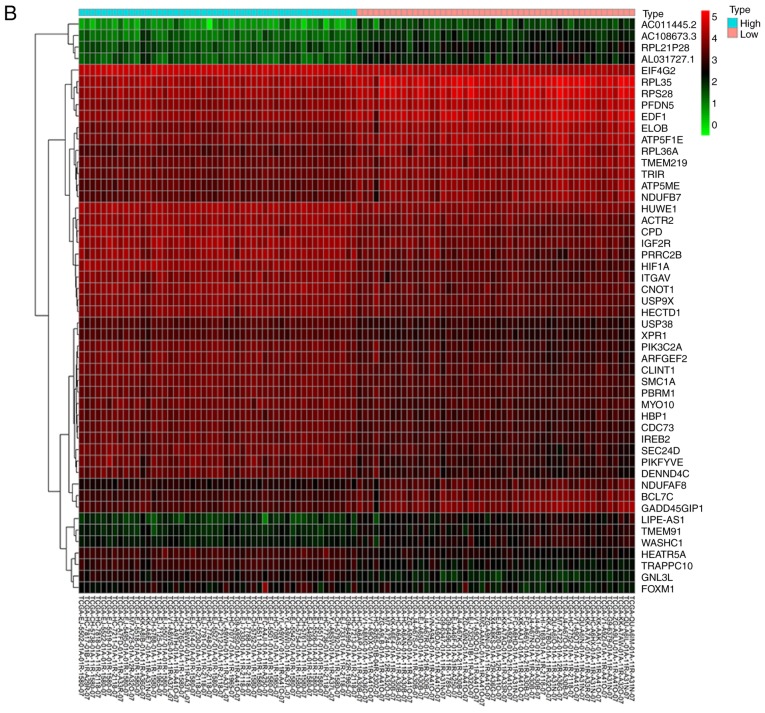
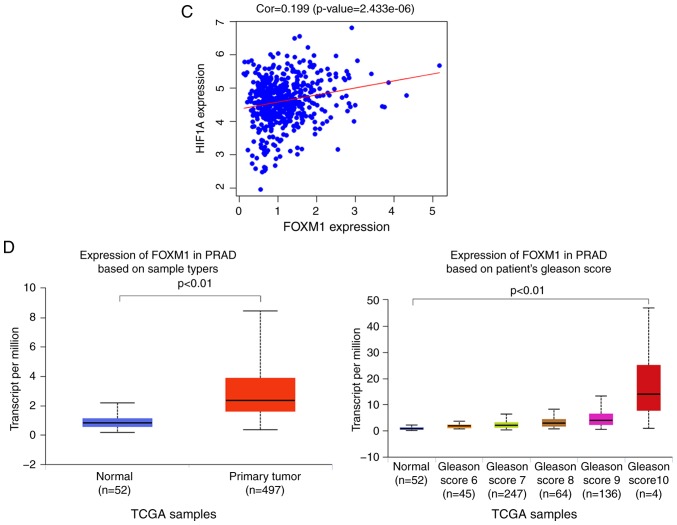
Bioinformatics analysis and the correlation between HIF-1α and FoxM1 in PCa. (A) High and low expression of HIF1A TCGA samples were used to identify DEGs. The results of GO and pathway enrichment applied on top 200 upregulated DEGs are shown in the bar plot, the higher the column and the darker the color, the smaller the P-value, and the corresponding enrichment entry is marked on the right. (B) The relative expression difference of DEGs was shown in the heatmap, where the green and red represented low and high expression, respectively. DEGs, differentially expressed genes; GO, Gene Ontology; FoxM1, Forkhead box M1; HIF1A, hypoxia-inducible factor 1α; has, homo sapiens; PCa, prostate cancer; PRAD, prostate adenocarcinoma; TCGA, The Cancer Genome Atlas. (C) Pearson correlation analysis of HIF1A and FoxM1 in TCGA prostate samples was performed; the red line represented the expression trend of the two genes. (D) The expression of FoxM1 in PRAD and normal prostate tissues (left panel), and the relationship between FoxM1 and Gleason scores (right panel). DEGs, differentially expressed genes; GO, Gene Ontology; FoxM1, Forkhead box M1; HIF1A, hypoxia-inducible factor 1α; has, homo sapiens; PCa, prostate cancer; PRAD, prostate adenocarcinoma; TCGA, The Cancer Genome Atlas.


