Figure 1.

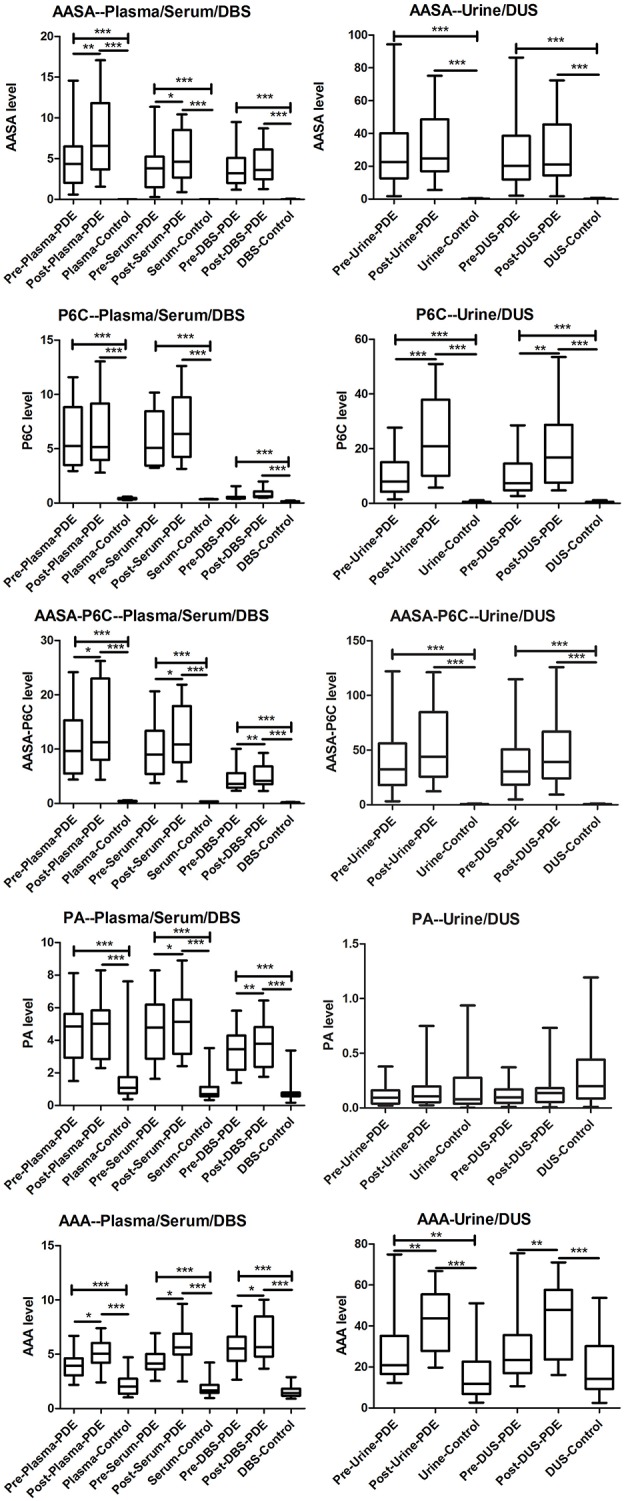
Box-plot of the a-AASA, P6C, AASA-P6C, PA, and a-AAA levels in PDE patients before and after taking a single oral dose of pyridoxine, as well as in control. *P < 0.05; **P < 0.01; ***P < 0.001.

Box-plot of the a-AASA, P6C, AASA-P6C, PA, and a-AAA levels in PDE patients before and after taking a single oral dose of pyridoxine, as well as in control. *P < 0.05; **P < 0.01; ***P < 0.001.