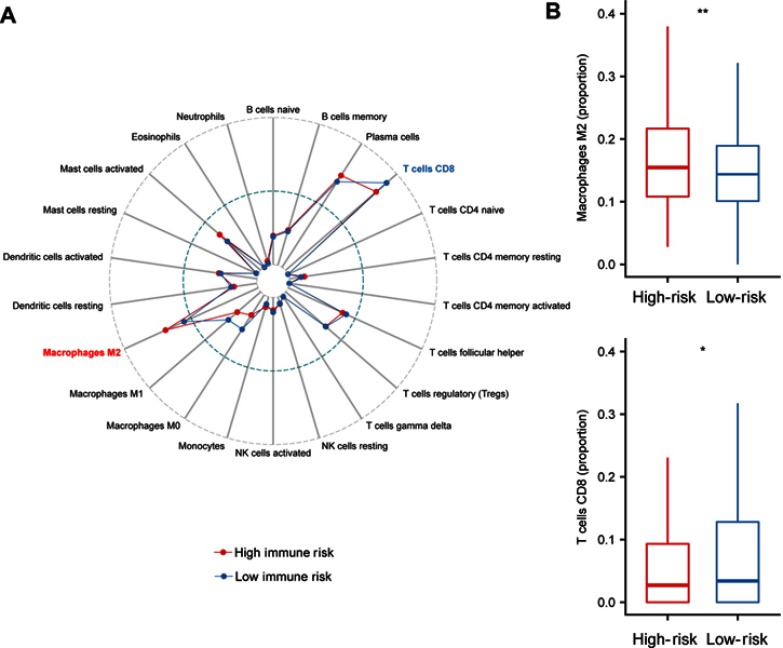
Figure 4.
Immune infiltration status within IRGPI risk groups. (A). Summary of the 22 immune cells’ abundance estimated by CIBERSORT for different risk groups. (B) The abundance distribution of specific Immune cells’ within different risk groups. Macrophages M2 was significantly highly expressed in the high-risk group (P=0.007), while the percentage of T cells CD8 was significantly higher in the low-risk group (P=0.02). P-values are based on t-test (*P<0.05, **P<0.01).
Abbreviation: IRGPI, immune-related gene pairs index.

