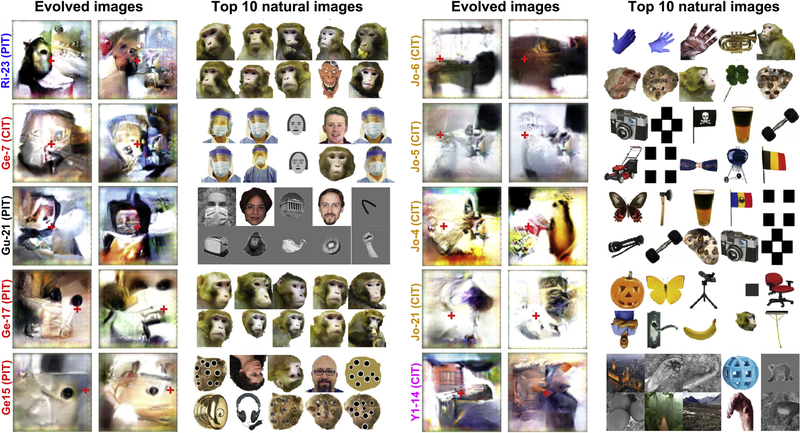
Figure 6. Evolution of synthetic images in other IT neurons.
Each pair of large images show the last-generation synthetic images from two independent evolution experiments for a single chronic recording site in 5 different animals. To the right of the synthetic images are shown the top 10 images for each neuron from a natural image set. Red crosses indicate fixation. The arrays were in the left hemisphere of monkey Jo, and in the right hemisphere of all the other animals. The natural images shown interleaved during each evolution were from either a 108 reference image set containing faces, bodies, places, and line segments (used for cells Gu-21 and Y1–14) or the set of 2550 natural images rank ordered in Fig. S2 for unit Ri-10 (used for all the other units in this figure). We also conducted a separate session testing Ge-7 and Ri-10 responses to natural and synthetic images two days after one of their evolution experiments.

